Gann HiLo Activator [CC]The HiLo Activator was created by W.D. Gann and I was surprised to not see more of his technical indicators on here. I will start adding more of his indicators on here if I get more interest. This is the original version of the indicator that performs like a trailing stop that also works well as a trend line. Buy when the line turns green and sell when it turns red.
Let me know if there are any other indicators you want me to publish!
Trailing

Combined MA Trend FilterToday I propose a simple but an effective tool to use as a trend identifier.
It is simple because it doesn't require user to tinker with it and it works on all scripts and all time frames.
It is effective because it's based on what I believe to be the most used ma's by the traders who are successful and usually trade with large qty.
So, what's under the hood?
-It's a combination of MA's and its alpha multiplier to replicate effect of higher TF MA without producing the weird square shapes.
-We are utilizing the range between the two as a way to identify "noise areas" or "ranging areas" for the price action, where taking a trade might not be the best decision.
-As soon as bar starts closing above the both MA and its alpha multiplier, it is in strong bullish zone
-And as soon as bar start closing below the same we have a strong bearish zone.
-Bar Colour coding
Lime - Strong Bullish sentiment
Yellow - Weak Sentiment (Ranged area)
Red - Strong bearish sentiment
-This indicator works in two modes, one is noise mode and one is noiseless mode.
When we select noiseless mode, we are utilizing here a filter to reduce noise, which can be also plotted on chart and option for doing so is given in settings.
Some examples?
I've used alpha of 5 in above examples (You can change it to anything you want, depending on your script and TF)
As you can see, it produces far better filtering and keeps you out from possible "noise areas" when trading, it is also good at working as scaling in and out tool for purpose of maximizing the profits when you do catch the trend.
Please note that higher the alpha you use, you will be shifting to higher TF MA, while its difficult to have a set number of set TimeFrame effect replication, its best to keep the alpha multiplier value around 5.
Authors note:
This indicator is free to use for all, I'm only protecting the code to avoid people selling it to unsuspecting new users. It happens a lot on TV.
Past performance does not mean future profit and trader is responsible for his own losses or profits, author does not take any responsibility to wrong application of the tool provided here.
Have a profitable trading journey and enjoy~

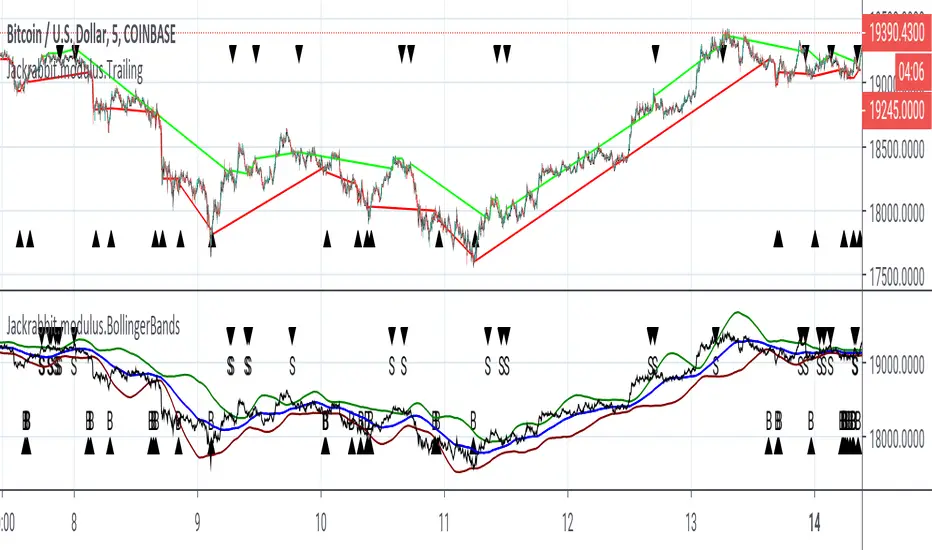
Jackrabbit.modulus.TrailingThis is a full, true, and pure implementation of trailing buy/sell for the Jackrabbit suite and modulus framework.
This module is not a standalone and relies on previous modules to send a signal data in order to function properly. This module acts on buy and sell data from within the indicator on indicator framework that TradingView supports.
This module adds the ability to trail a buying position to its lowest value or if it breaks a retracement percentage (user defined). It also allows trailing a sell position with an user defined retracement. It can managing buy and selling or just buying or selling.
This module does NOT allow accumulation during the trailing process. If a buy signal is received while the module is already trailing a previous position, if the price is lower then the previous position, the current position is used, otherwise it is ignored. The same holds true for selling. Once the position is bought, accumulation will resume as normal for the next position.
The chart displays (for both buying and selling):
The current price, its retracement value, and the original price.
Note that the buy or sell does NOT actually take place until the price action crosses retracement.
The Jackrabbit modulus framework is a plug in play paradigm built to operate through TradingView's indicator on indicatior (IoI) functionality. As such, this script receives a signal line from the previous script in the IoI chain, and evaluates the buy/sell signals appropriate to the current analysis.
This script is by invitation only. To learn more about accessing this script, please see my signature or send me a PM. Thank you.
Trailing StopThis indicator is a simple trailing stop.
with this we can trail our price.
inputs that we can put with this indicator are:
1. Entry price: open, close, high, low, etc.
2. Position: Long, Short
3. Stop loss range: integer value only
4. Entry hour, Entry minute, Entry month, Entry Year, Entry Day
By taking all the above input this will work according to the input.
Thank You.

Buy/Sell/TP/SL/TSL Alerts ModuleThis tool is not a self-sufficient indicator, just an attachable module that allows you to enhance a specific indicator with risk management components without having a headache.
What you need to do, and actually this is the most important step, is to rewrite your indicator to a buy-sell signal form which will output only -1, 0, 1 values and then connect it to the module.
After that the module gives you a lot of possibilities to customize Take Profit, Stop Loss and Trailing Stop Loss levels through the settings window and to set all the alerts you need up.
Simple Buy/Sell setup for the RSI:
Now I am adding Stop Loss:
and Take Profit:
and finally Trailing Stop Loss:
Okay, I have shown how it works with RSI signals. Here is example for the MACD:
and example for the WaveTrend Oscillator:
If you have any questions don't hesitate to ask and contact me either via private messages on TradingView or via Telegram

SuperTrailThe SuperTrail indicator is similar to the very popular and widely used SuperTrend but it has been improved to use a percentage value instead that helps users to determine the natural trading range of a stock over a period of time, and set stop losses (especially trailing stops) accordingly.
The best way to use it is to find stocks in a steady trend (upwards if you are going long or downwards if you are going short) and keep changing the indicator percentage levels until you identify a percentage that keeps you in the trade for longer without getting stopped out too often. You can then set this value in your trading program, or set an alert within Trading View to notify you if something changes and you need to take an action.
Some stocks might have little volatility and only require an 8% trail. Some might be more volatile and work better with a wider 20% trail. It also depends on your time frame. Shorter time frames are typically shorter stops. Longer time frames work better with wider stop values. The best thing about this tool is that it helps you identify the best optimised stop loss range to set for each individual stock based on its range.
The indicator works on any time frame - minutes to hours to weeks. If you want to hold stocks for a shorter time you might look at the natural range over the last 7 days, medium term the range over the last 3 months, or if you want to hold a stock for a much longer period of time then perhaps look to identify the range over the last 12 months. If you get stopped out of a stock you like, then set an alert, and when the stock moves back up within its range you can decide on whether or not you re-enter.
It is a super simple indicator. As always it is meant only as a visual guide to assist you with your trading and you will get better results by combining it with another indicator like an OBV or RSI. You can check out my Trading View channel to see how I have used it across different stocks and based it on different time periods.
I have also made and uploaded a video to my Trading View account showing how it works and how I use it.
Message me if you would like access.

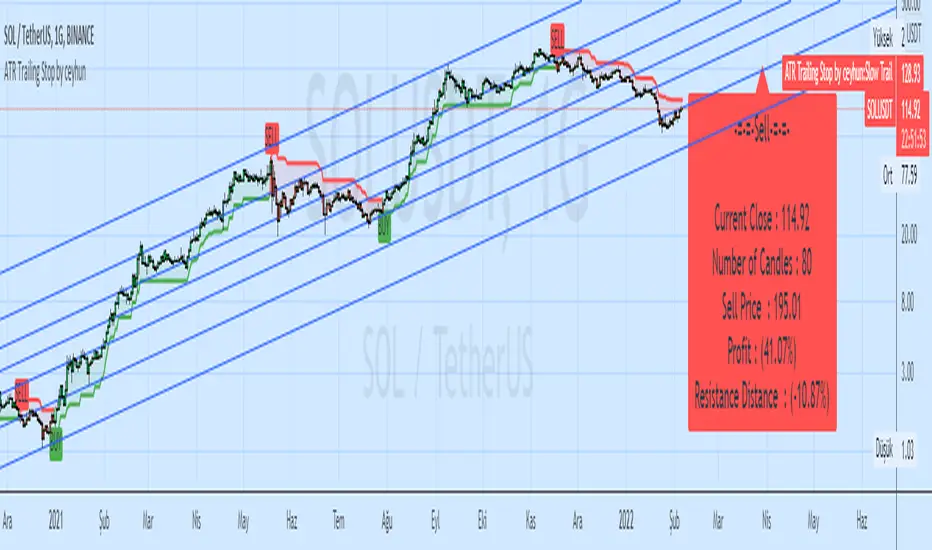
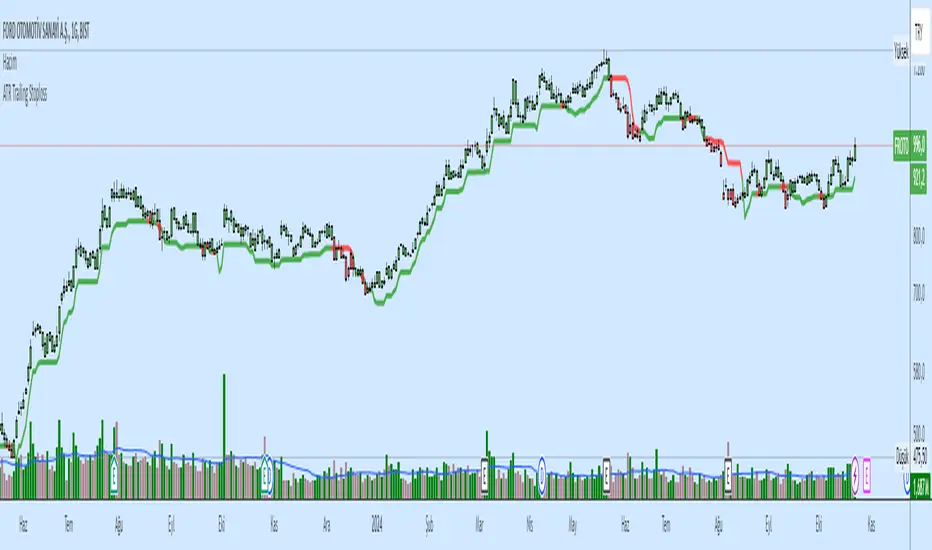
ATR Trailing Stop by ceyhunSame coding only coloring and information panel was added.
CDC ATR Trailing Stop V2.1 (2013)
//Barcolor
Green = Trail1 > Trail2 and close > Trail2 and low > Trail2
Blue = Trail1 > Trail2 and close > Trail2 and low < Trail2
Red = Trail2 > Trail1 and close < Trail2 and high < Trail2
Yellow = Trail2 > Trail1 and close < Trail2 and high > Trail2
//It gives White color where there is deterioration.
//InfoPanel
Buy Price = Blue draws the circles at the purchase price.
Profit Long>20 = Risk level taken as a percentage, I got the highest 20%, you can determine as you wish.
Sell Price = Red draws the circles at the purchase price.
Profit Short>20 = Risk level taken as a percentage, I got the highest 20%, you can determine as you wish.
Percent Trailing Stop (%) - For Study Scripts===========
Percent Trailing Stop (%) - { FOR STUDY SCRIPTS }
===========
Wow - this is an example of how to implement Alerts relating to a Trailing Stop (%) within your Study Script. It's taken a bit of effort to get this working but I think we got there!
Alerts include Open Long/Short, Trailing Stop Hit, and (the most important one) Movement of Trailing Stop! <- this is actually really quite good, by the way! :)
You can ignore the actual entry/exit orders - they're based on a simple MA cross and are therefore NOT relevant, NOT profitable and NOT recommended!
You should be using this code as a way of adding a Trailing Stop to your own scripts - hope it helps!
Set your "Open Long/Short" Alert to "Once per Bar Close" - Set your "Trailing Stop Hit" Alert to "Once per Bar" - Set your "Move TSL" Alert to "Once per Bar Close". - You're all done! Enjoy.
-----------
Good Luck and Happy Trading!

Guppy Count Back LineThe Guppy Count Back Line was created by Daryl Guppy and is essentially a trailing stop indicator. I have color coded the indicator to tell you if you should go long or short.
This was a special request so let me know if you would like me to write more scripts for other indicators!

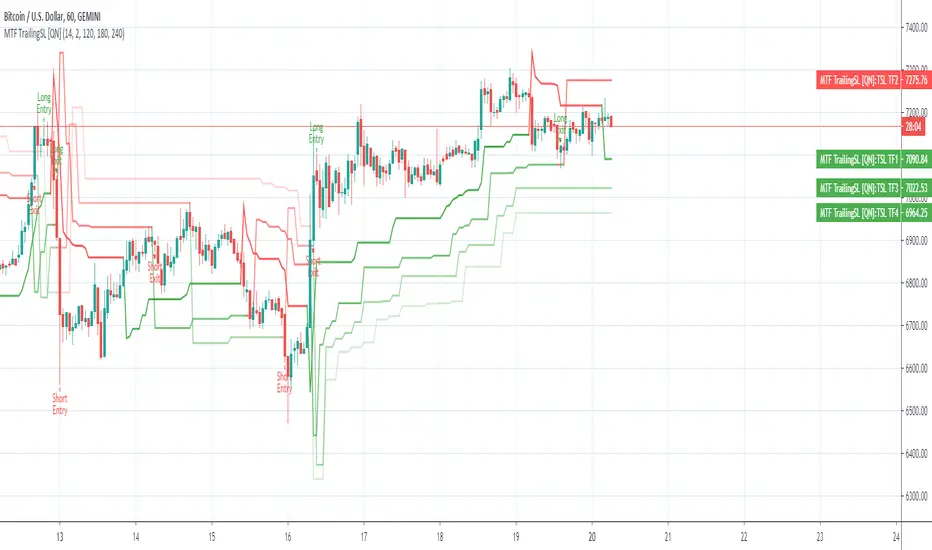
MTF Trailing SL Alerts [QuantNomad]These are alerts for my MTF Trailing SL Strategy.
Entry Long position if all 4 time-frames agree on the long signal.
Exit Long positions when at least 2 time-frames disagree on the long signals.
Entry to Short position if all 4 time-frames agree on Short signal.
Exit from Short positions when at least 2 time-frames disagree on Short signal.
Use "Once Per Bar Close" when creating alerts.
Link to the strategy:
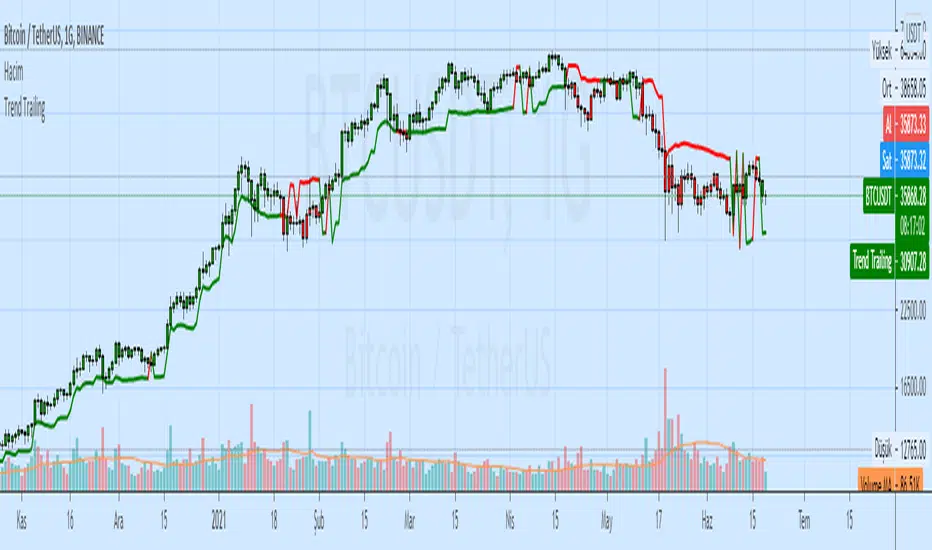
Trend TrailingAndrew Abraham
It can be used as:
- stop loss indicator
- indicator of support and resistance
- buy and sell signals
Simple Moving Average - ATR Trailing StopThe old adage goes "Cut losers fast and let the winners run"
With this in mind, this will plot a dynamic trailing stop by subtracting any multiplier of the Average True Range (ATR) from the SMA of your choice.

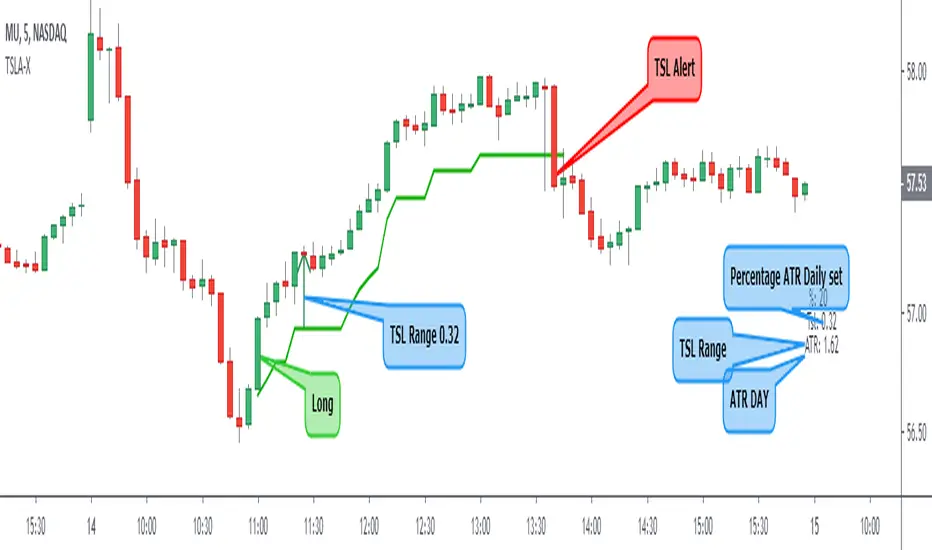
Trailing Stop Loss ATR + AlertI share this TSL indicator with alert (I use it only for Stocks), the configuration is very simple, you must select if it is a Short or Long operation, time at which the operation was opened,% of the daily ATR for TSL. It also contains:
- Alert
- Panel Info
ATR Trailing Stop Indicator [Chart]I rely on this script for both my live trading and my backtesting process. I couldn’t live without it. It’s extremely simple – all it does is calculate your trailing stop price.
How It Works
The first number in blue is the current ATR (pips). The second number in green is your trailing stop loss price for Long trades, and the third number in red is your trailing stop loss price for Short trades.
For short trades, the stop loss price is calculated by adding the current ATR value to the highest-high of the given lookback period.
For long trades, the stop loss price is calculated by subtracting the current ATR value from the lowest-low of the given lookback period.
Settings
ATR Length:
ATR period (how many candles to include in the calculation).
Use Structure?
If set to true, the script will use swing lows and highs in its calculation. If set to false, the script will ignore swing lows and highs and give you the distance of the ATR from the current candle close instead.
How Far To Look Back For High/Lows:
Candle lookback period for swing high/lows.
ATR X ?:
This controls your ATR multiplier. For example, if you want to use a 2x ATR stop, set this to 2.
Tool Companion:
Here is the tool companion script for this indicator:
Source Code:
Go to zenandtheartoftrading.com for the source code – it’s free!
ATR Trailing Stop Loss IndicatorI rely on this script for both my live trading and my backtesting process. I couldn’t live without it. It’s extremely simple – all it does is calculate your trailing stop price.
How It Works
The first number in blue is the current ATR (pips). The second number in green is your trailing stop loss price for Long trades, and the third number in red is your trailing stop loss price for Short trades.
For short trades, the stop loss price is calculated by adding the current ATR value to the highest-high of the given lookback period.
For long trades, the stop loss price is calculated by subtracting the current ATR value from the lowest-low of the given lookback period.
Settings
ATR Length:
ATR period (how many candles to include in the calculation).
Use Structure?
If set to true, the script will use swing lows and highs in its calculation. If set to false, the script will ignore swing lows and highs and give you the distance of the ATR from the current candle close instead.
How Far To Look Back For High/Lows:
Candle lookback period for swing high/lows.
ATR X ?:
This controls your ATR multiplier. For example, if you want to use a 2x ATR stop, set this to 2.
Chart Companion:
Here is the chart companion script for this indicator:
Source Code:
Go to zenandtheartoftrading.com for the source code – it’s free!
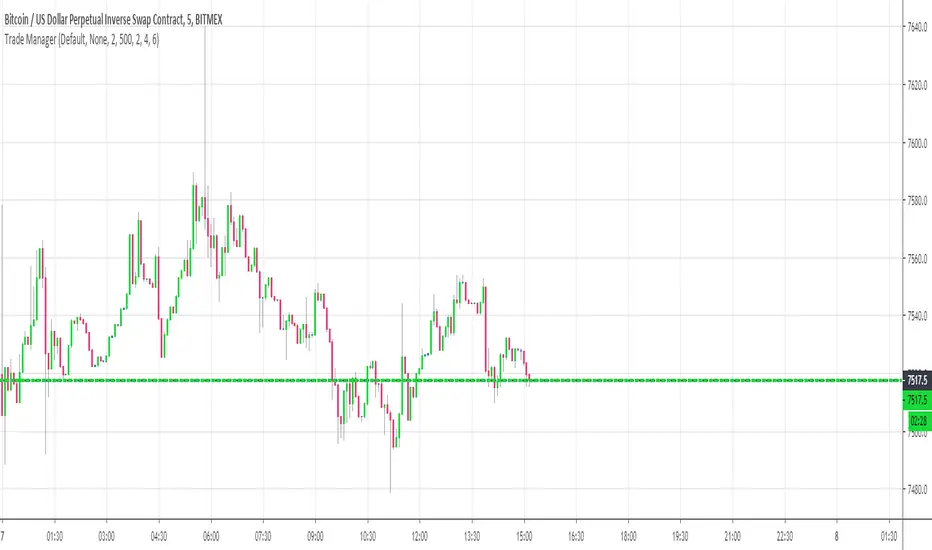
Trade Manager (Open Source Version)Hello my young padawans looking for the FORCE to get richer on your next trade
I got pinged at least three times today asking where the hell is the indicator of the day. You asked, I delivered :)
Here's your free open-source Trade Manager Version. My associates might kill me for sharing that one... anyway this is a real GIFT.
I won't share such quality indicators too often for FREE so hope you'll appreciate its value. It can really help with your day to day trading (on top of making your charts looking more awesome)
This is an even better version compared to my previous Trade Manager Trade-Manager . It's basically a standalone version, meaning you'll have to update with 2 lines your own indicator and follow my educational post from yesterday (pasted it below also) to learn how to do it
Please read this educational post I published for you before proceeding further : How-to-connect-your-indicator-with-the-Trade-Manager
From here you normally connected the data source of your own indicator to the Trade Manager. If not, here's a reminder of the article mentionned above
Step 1 - Update your indicator
For the screenshot you see above, I used this indicator : Two-MM-Cross-MACD/ . "But sir are you really advertising your other indicators here ??" ... hmmm.... YES but I gave them for free so ... stop complaining my friend :)
Somewhere in the code you'll have a LONG and a SHORT condition. If not, please go back to study trading for noobs (I'm kidding !!!)
So it should look to something similar
nUP = ma_crossover and macd_crossover
nDN = ma_crossunder and macd_crossunder
What you will need to add at the very end of your script is a Signal plot that will be captured by the Trade Manager. This will give us :
// Signal plot to be used as external
// if crossover, sends 1, otherwise sends -1
Signal = (nUP) ? 1 : (nDN) ? -1 : na
plot(Signal, title="Signal")
The Trade Manager engines expects to receive 1 for a bullishg signal and -1 for bearish .
Step 2 - Add the Trade Manager to your chart and select the right Data Source
I feel the questions coming so I prefer to anticipate :) When you add the Trade Manager to your chart, nothing will be displayed. THIS IS NORMAL because you'll have to select the Data Source to be "Signal"
Remember our Signal variable from the Two MM Cross from before, now we'll capture it and.....drumb rolll...... that's from that moment that your life became even more AWESOME
The Engine will capture the last signal from the MM cross or any indicator actually and will update the Stop Loss, Take Profit levels based on the parameters you set on the Trade Manager
It should work with any indicator as long as you're providing a plot Signal with values 1 and -1 . In any case, you can change the Trade Manager you'll find a better logic for your trading
Now let's cover the different parameters of the tool
It should be straightforward but better to explain everything here
+Label lines : if unchecked, no SL/TPs/... will be displayed
+Show Stop Loss Signal : Will display the stop loss label. You have the choice between three options :
By default, the Stop Loss is set to NONE. You'll have to select a different option to enable the Stop Loss for real
++Percentage : Will set the SL at a percent distance from the price
++Fixed : SL fixed at a static price
++Trailing % : Trailing stop loss based on percentage level
The following is a KEY feature and I got asked for it many times those past two days. I got annoyed of getting the same request so I just did it
++Trailing TP: Will move the Stop Loss if the take profit levels are hit
Example: if TP1 is hit, SL will be moved to breakeven. If TP2 is hit, SL will be moved from TP1 to TP2
+Take Profit 1,2,3 : Visually define the three Take Profit levels. Those are percentage levels .
Meaning if you set TP1 = 2, it will set the TP1 level 2% away from the entry signal
Please note that once a Take profit level is reached, it will magically disappear. This is to be expected
I'll share in the future a way more complete version with invalidation, stop loss/take profits based on indicator, take profit based on supports/resistances, ...
I believe is such a great tool because can be connected to any indicator. I confess that I tried it only with a few... if you find any that's not working with the Trade manager, please let me know and I'll have a look
PS
I want to give a HUUUUUUUGE shoutout to the PineCoders community who helped me finishing it
Wishing you all the best and a pleasant experience with my work
David

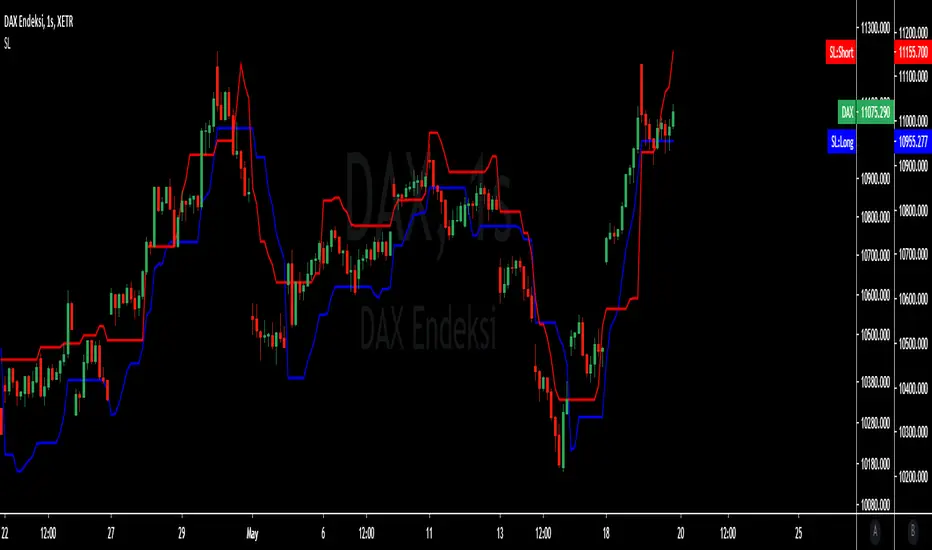
Trade ManagerHello everyone
Hoped you had a great weekend and are ready for what's coming this week
I'll never fail to satisfy my audience on TradingView and I'll start by sharing some heavy stuff.... Imagine the most amazing thing you had in your life. You got it ? now multiply this good feeling by 100 !!! OK... now I have a tool that is beyond that litteraly. Don't believe me, here's the Trade Manager ladies and gentlemen, I could barely contain my excitement this weekend to share it with the community
I wasn't sure of sharing it but you guys did a great job with my other indicators giving me constructive feedback to improve them. Also, those helping me with such feedback usually get the indicator for a lifetime access for free.
Please read this educational post I published for you before proceeding further : How-to-set-an-indicator-to-work-with-the-Trade-manager/
From here you normally connected the data source of your own indicator to the Trade Manager. If not, here's a reminder of the article mentionned above
Step 1 - Update your indicator
Somewhere in the code you'll have a LONG and a SHORT condition. If not, please go back to study trading for noobs (I'm kidding !!!)
So it should look to something similar
macrossover = crossover(MA1, MA2)
macrossunder = crossunder(MA1, MA2)
What you will need to add at the very end of your script is a Signal plot that will be captured by the Trade Manager. This will give us :
// Signal plot to be used as external
// if crossover, sends 1, otherwise sends -1
Signal = macrossover ? 1 : macrossunder ? -1 : na
plot(Signal, title="Signal")
The Trade Manager engines expects to receive 1 for a bullishg signal and -1 for bearish .
Step 2 - Add the Trade Manager to your chart and select the right Data Source
I feel the questions coming so I prefer to anticipate :) When you add the Trade Manager to your chart, nothing will be displayed. THIS IS NORMAL because you'll have to select the Data Source to be "Signal"
Remember our Signal variable from the Two MM Cross from before, now we'll capture it and.....drumb rolll...... that's from that moment that your life became even more AWESOME
The Engine will capture the last signal from the MM cross or any indicator actually and will update the Stop Loss, Take Profit levels based on the parameters you set on the Trade Manager
Now I'll cover the different parameters of the tool
It should be straightforward but better to explain everything here
+Label lines : if unchecked, no SL/TPs/... will be displayed
+Show indicators : This does nothing. Tradingview doesn't give the possibility to set Labels on an UI so we have to use this hack with a useless checkbox
+Show PnL Panel : Will show a Panel at the right of your chart with the PnL updated for the last position only. In a future version, I'll make it work to list maybe the previous N positions defined by the user
+Show Stop Loss Signal : Will display the stop loss label. You have the choice between three options :
++Percentage : Will set the SL at a percent distance from the price
++Fixed : SL fixed at a static price
++SuperTrend : Trailing stop loss based on Supertrend
'll add many more options this week for sure
+Take Profit 1,2,3 : Visually define the three Take Profit levels
Please note that once a Take profit level is reached, it will magically disappear. This is to be expected
This indicator is a first draft of what I believe is such a great tool because can be connected to any indicator. I confess that I tried it only with a few... if you find any that's not working with the Trade manager, please let me know and I'll have a look (for free)
I'm so excited to share it with all of you and that's the best possible way I could ever dreamt of to start the week with my TradingView community
Wishing you all the best and a pleasant experience with my work
David
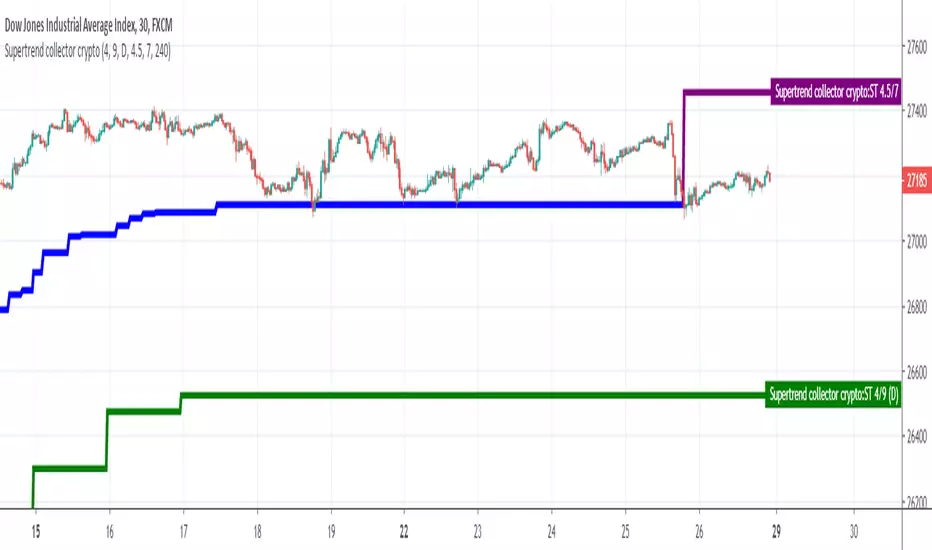
Supertrend collectorHello traders
This is an example of how you can add multiple indicators into a unique one
In this instance, I added two supertrend multitimeframes and draw them on a different timeframe chart
Enjoy
David

Boxes TrailUsing Trail system and volume trail combination we can make this indicator
buy is when the box is blue , sell when box is red
the length here is 100 , you can make it shorter if you want it to buy more or sell more
it easy trailing system with signals and alerts

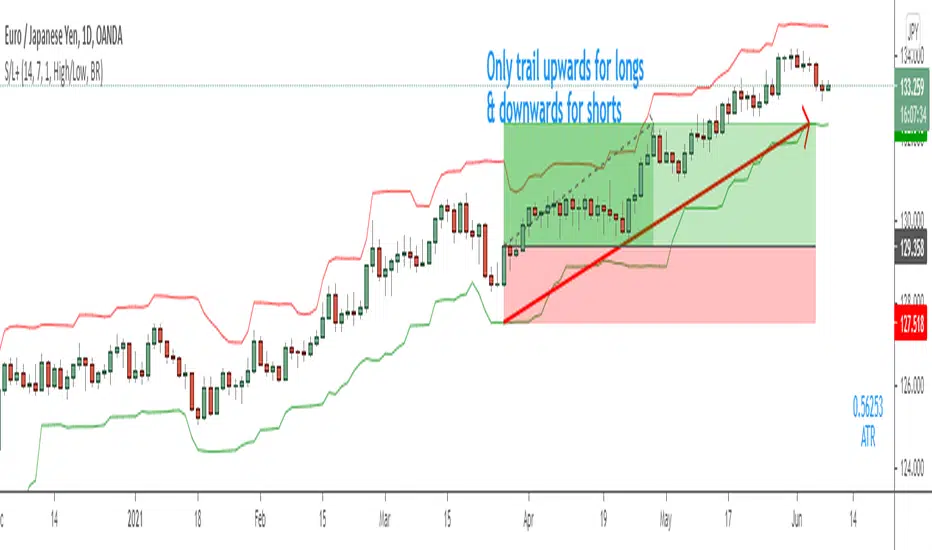
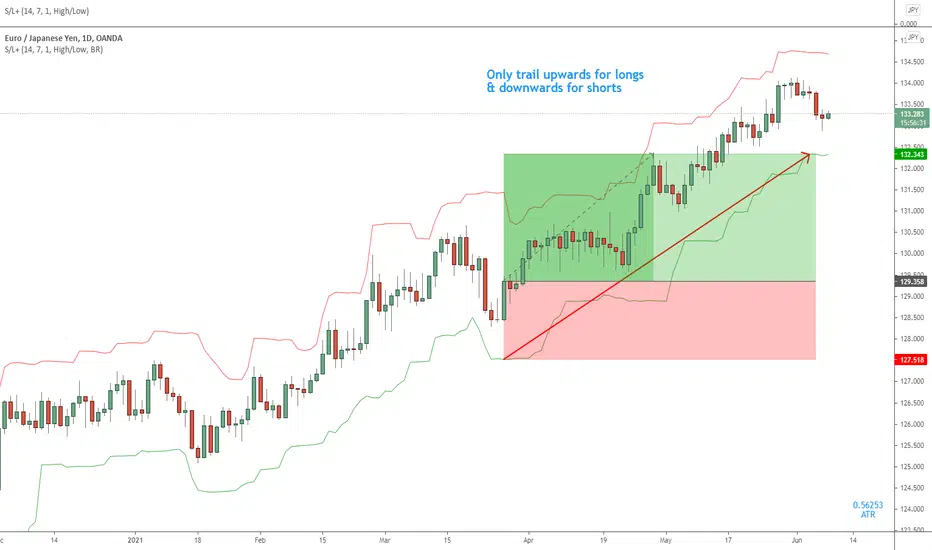
ATR for Trailing StopAn ATR (Average True Range) can be used to position a trailing stop
In this script, the true range of today is calculated based on the low of yesterday in order to be more stable.
It only goes up, as a trailing stop should do.
It only goes down when the trailing stop is reached by the price.
