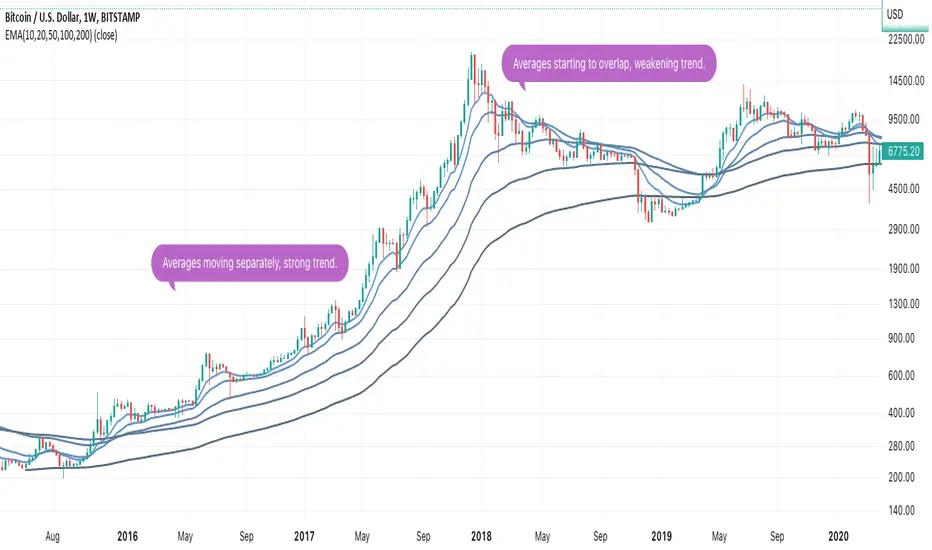
VWMA Trend FilterHere's a simple tool for determining long term trend direction using two Volume Weighted Moving Averages (VWMA). The VWMA's emphasis on volume often makes it a better measurement for trend direction than the more popular Exponential Moving Average (EMA).
Trend direction is determined by comparing a fast and slow VWMA. The default length for the fast VWMA is 50 periods, while the slow uses a default length of 200. Both of these lengths can be modified in the input options menu. The default source for the VWMA's is HLC3((high + low + close) / 3).
If the fast VWMA is greater than the slow VWMA, then the trend is bullish and the background color is green. If the fast VWMA is less than the slow VWMA, then it is bearish and the background color is red.
We included an option to change the candle color based on whether the VWMA's indicate a bullish or bearish trend as well.
Overall, this is one of those utility tools that we like to use as an overlay over the main price chart and in conjunction with other signal generating indicators. Its purpose isn't to generate buy and sell signals, but it works well as a visual confirmation tool to help traders gauge trend direction.
Trend

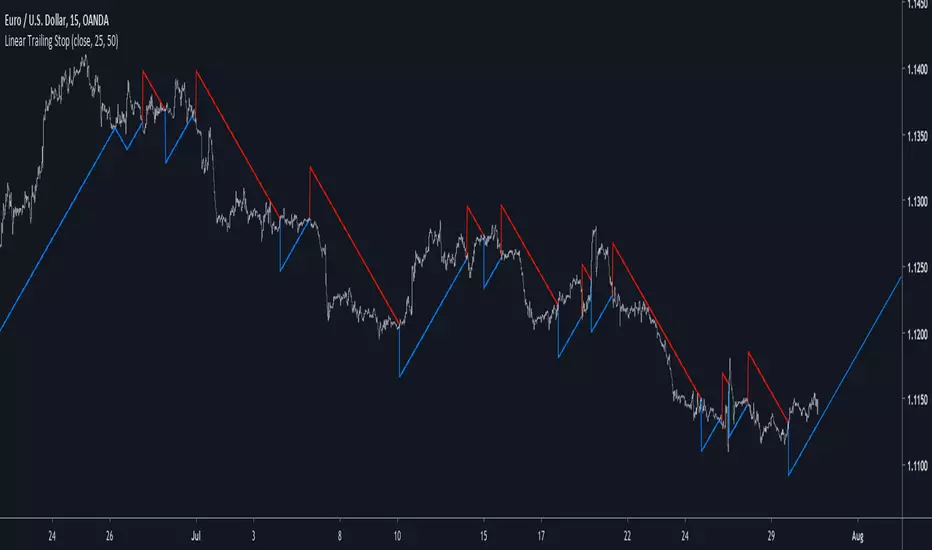
Linear Trailing StopBased on my latest script "Linear Channels"
This is a trailing stop version of the linear channels. Thanks to capissimo for helping me fix several issues with the linear extrapolation part.
In order to know how the indicator work i recommend reading the post on the Linear Channels indicator here
Hope you like it and feel free to leave your suggestions :)
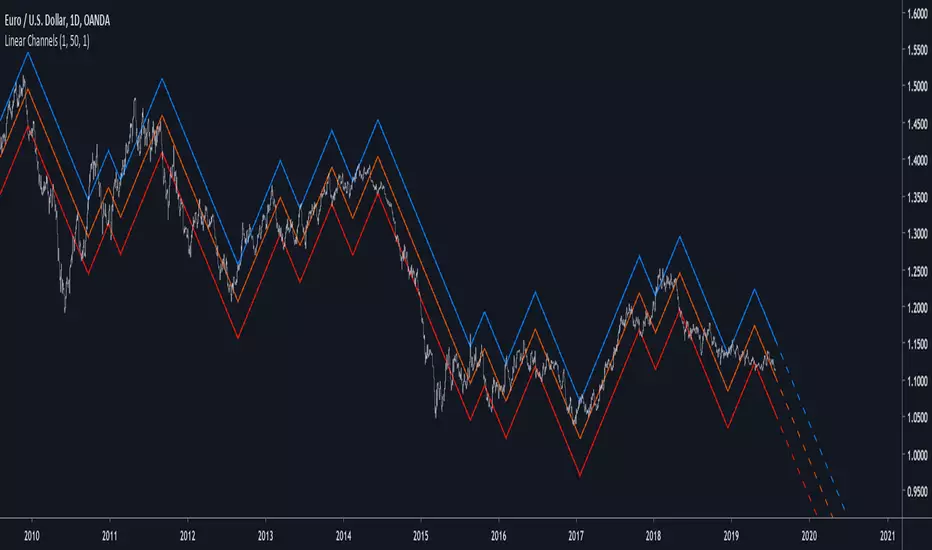
Linear ChannelsIntroduction
I already made an indicator (simple line) that tried to make lines on price such that the results would not repaint and give a good fit to the price, today i publish a channels indicator based on the simple line indicator. The indicator aim to show possible support and resistance levels when the central line posses a low sum of squares with the price, a linear extrapolation was also provided in order to show possible future price positions respective to the channels.
The Indicator
The emphasis parameter of the simple line indicator has been removed, instead we keep length and mult as numerical input parameters. In general length control how persistent the lines are, larger values will create longer lines on average, mult help make the line fit to the price better but might as well affect how spread the channels are as well as the lines average length. When mult > length the lines will fit better the price while when length >= mult the fit might not be the best.
The point parameter allow you to fix the indicator when using it on high market price values or when the indicator exhibit a weird behaviour.
point = false on btcusd
point = true
If the lines still does not fit well enough try to lower length.
I know this might result inconvenient in so many ways but i'am working on simplifying things. Therefore some larger price values might use lower length and use mult instead. For market not using the point parameters a settings of : length > 1 and mult = length*2 might provide a good to go setup.
The channel spreading parameter allow to make spread the channels by a certain factor.
Issues
I'am still not good with line extensions, if it bother you deactivate the extrapolation parameter. Sorry for the inconvenience.
Conclusion
It is possible to make non repainting linear indicators, and i'am working on some of them. While some might argue that price is not linear thus not requiring the use of linear indicators it can still be interesting to use those if they, unlike the linear regression, don't repaints and provide a way to change their directions according to the price trend.
Thanks for reading !
Hull Trend with KahlmanThis is an update to the idea of
The Kahlman smoother makes the signal more precise (by one candle).


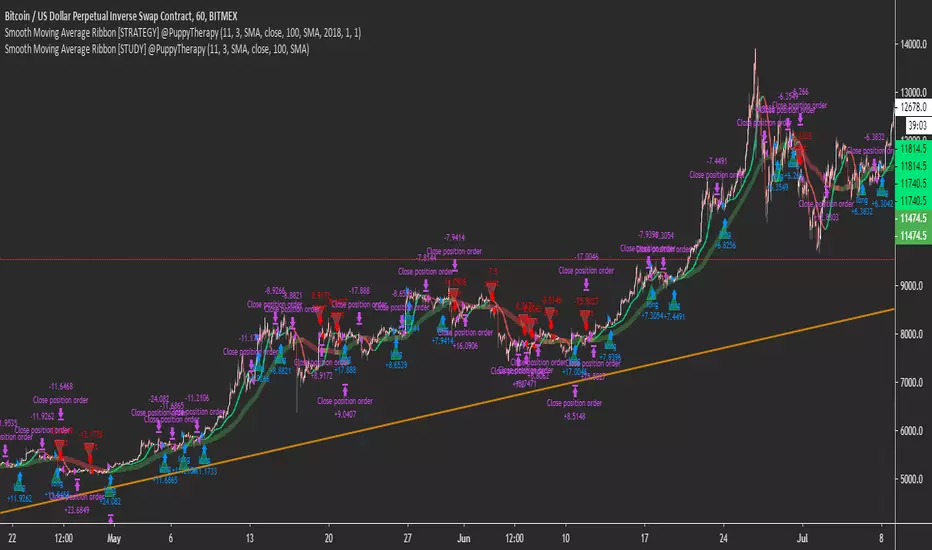
Smooth Moving Average Ribbon [STUDY] @PuppyTherapyThe Smooth moving average ribbon script is an enhancement of the script I posted yesterday. But will help you also create a very simple trend-following strategy or a simple trend-following filter.
You are able to select from a large variety of moving averages add Heikin Ashi Candles as a source and also add additional smoothing to every single of the moving averages.
The Study script is equipped with alerts.
It is a showcase that a simple strategy like buy when we going up and sell when we going down actually works especially on a bigger timeframe.
Thanks to all supporters and everget for some of the moving average scripts.
Smooth Moving Average [STUDY] @PuppyTherapyThe Smooth moving average script combo combines the ability to help you create a very simple trend-following strategy or a simple trend-following filter.
You are able to select from a large variety of moving averages add Heikin Ashi Candles as a source and also add additional smoothing to every single of the moving averages.
The Study is equipped with alerts.
It is a showcase that a simple strategy like buy when we going up and sell when we going down actually works especially on a bigger timeframe.
Thanks to all supporters and everget for some of the moving average scripts.

SVAMA - A Non Parametric Adaptive Moving Average Based On VolumeIntroduction
Technical indicators often have parameters settings that the user must enter, those are inconvenient when the user must design a strategy because such settings must be optimized, it must also been noted that the optimal settings at time t could change at time t+n , this is why non parametric indicators are more efficient. Today i propose a moving average adapting to the market volume without using parameters affecting the smoothing.
The Indicator
The volume is rescaled in a range of (1,0) by using max or min normalization. Exponential averaging is used to provide the moving average.
When using max normalization the moving average react faster when the volume is closer to its all time high, when using min normalization the moving average react faster when the volume is closer to its all time low. You can select the method (max or min) from the "Method" parameter.
Volume tend to be higher and more periodic with higher time-frames, this is why lower time-frames might return smoother results when using the Max method. It is recommended to use the Max method when we want a faster moving average while the Min method is more suited to get a slower moving average.
Both methods can provide an interesting MA-Cross system when used on higher time frames.
Conclusion
There should be more non parametric indicators, this would allow for faster and easier optimization processes when creating a strategy, in theory any indicator using a moving average or highest/lowest could be made non parametric by using a running mean or running max/min but the indicator might loose important information.
This is one of my main focus right now since such indicators could also allow for improvements when used with artificial intelligence. I hope you find an use to it, don't hesitate to send me your suggestions.
Thanks for reading !

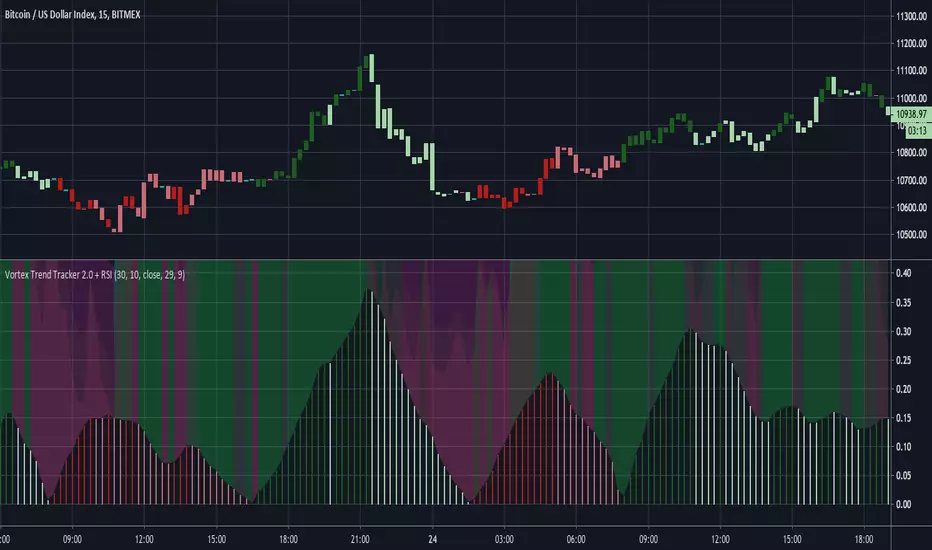
Vortex Trend Tracker 2.0 + RSIHere's an updated version of our Vortex Trend Tracker indicator.
Here's the link to the original if anyone wants to read more about the Vortex or see the first version:
We've added in 4 rsi's of varying lengths for this second version(2 fast and 2 slow) that create the background color effect.
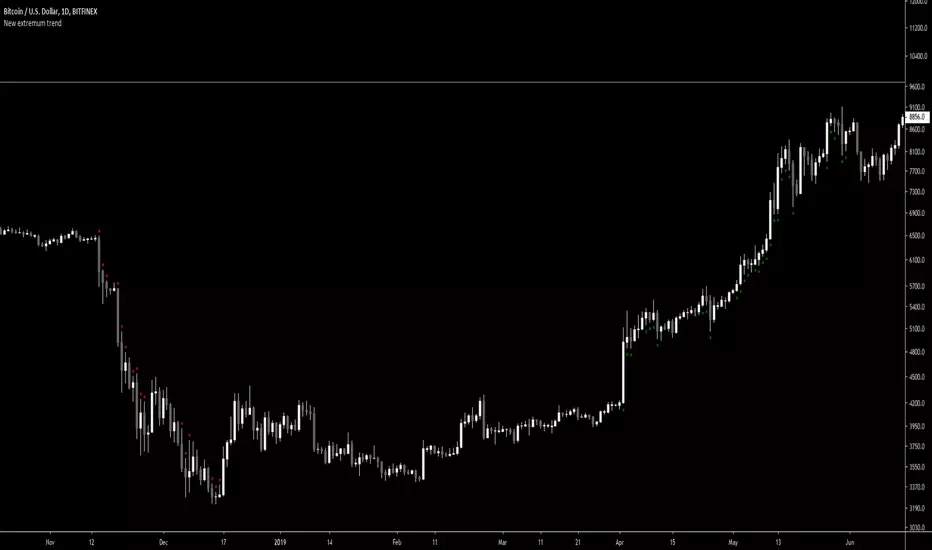
New extremum trendScript for filtering out periods when market is not trending.
It defines downtrend as following:
Lowest price of last 2 days is equal or lower then lowest price of last 100 days.
Values 2 and 100 are customizable.
Uptrend analogically with highs.
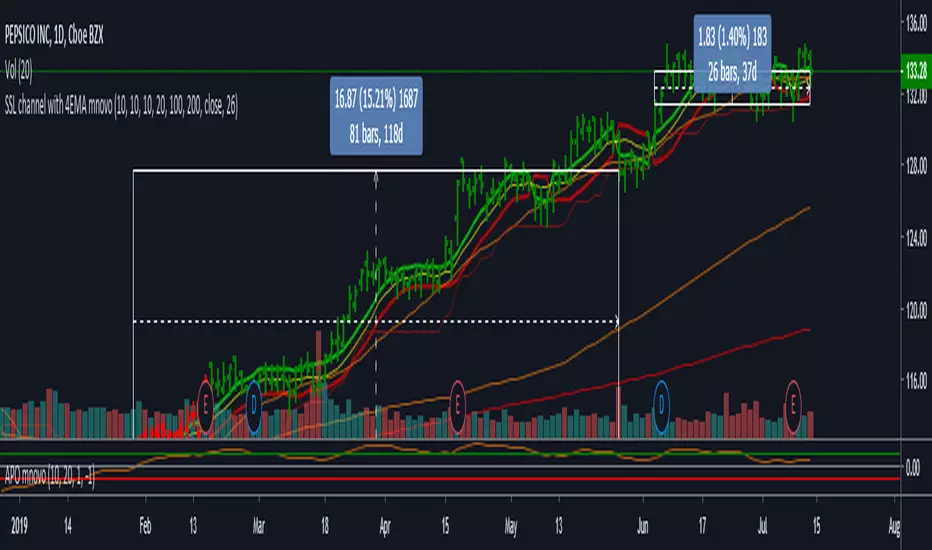
SSL 4EMA Kinjun-Sen mnovo IndicatorFor thos who prefer Kinjun-Sen from the Ichimoku algo to use as your baseline.
Trade safe
mnovo
AntiRekt RibbonThis script is a fork of the Madrid Ribbon, the only difference is that you can color your bars depending on the trend.

Adaptive Autonomous Recursive Moving AverageIntroduction
Using conditions in filters is a way to make them adapt to those, i already used this methodology in one of my proposed indicators ARMA which gave a really promising adaptive filter, ARMA tried to have a flat response when dealing with ranging market while following the price when the market where trending or exhibiting volatile movements, the filter was terribly simple which is one of its plus points but its down points where clearly affecting its performance thus making it almost impractical.
Today i propose a new filter A2ARMA which aim to correct all the bad behaviours of ARMA while having a good performance on various markets thanks to the added adaptivity.
Fixes And Changes
ARMA was dealing with terribles over/under-shoots which affected its performance, adding a zero-lag option made the thing even worse, in order to fix those mistakes i first cleaned the code, then i removed the offset for src in d , this choice is optional but the filter is sometimes more accurate this way.
The major change is the use of an adaptive moving average instead of the triangular moving average that smoothed the output, this adaptive moving average is calculated using exponential averaging while using the efficiency ratio as smoothing variable, this choice surprisingly removed the majority of overshoots while adding more adaptivity to the filter.
The Indicator
The Indicator work the same way as ARMA, not reacting during flat market periods while following the price when this one is volatile or trending. length control the smoothing amount while gamma determine how the filter is affected during flat market periods, gamma = 0 is just a double smoothed adaptive moving average, higher values of gamma will filter flat markets with a certain degree.
On Intel Corp with gamma = 0, i want to filter the flat period starting at July 10, gamma = 3 will certainly help us on this task.
Hooray, the problem appear to be solved ! Lower values of gamma also produce desirable effect as shown below :
gamma = 2
So far so good, but gamma or length might have different optimal values depending on the market, also problems still exists as shown here :
Seagate is tricky, gamma at 2.4 might help
The relationship between length and gamma is somewhat complicated.
On Different Markets
While some filters will process market price the same way no matter the market they are affected, A2ARMA will change drastically depending of the market.
On AMD
On EURUSD
On BTCUSD
Comparison With ARMA
ARMA with parameters roughly matching A2RMA, overall most of the problems i wanted to fix where indeed fixed.
Conclusion
A huge thanks for the support i received during this "Blank Page" period i'am suffering, ARMA was an indicator i really wanted to further develop without giving up on the code simplicity and i think this version might provide useful results, we can also notice that the decision making is easier with this version of the indicator thanks to the added coloring (which would have been impossible with ARMA).
My work don't have license attached to it, feel free to modify and share your findings, mentioning is appreciated :)
Thanks for reading !

Vortex Trend TrackerThough it may sound complex, the Vortex Indicator is essentially an uptrend line and a downtrend line. The vortex indicator can be used for a variety of purposes, including tracking the strength of trends, identifying/anticipating reversals, and generating entry/exit signals. It’s calculation is shown in the open-source code below.
To reduce the number of whipsaws produced by the indicator, we used an Exponential Moving Average of vmPlus and vmNegative values with a default length of 10. Decreasing this length will result in a more responsive vortex at the cost of more whipsaws and false signals.
The chart shows the absolute value of the difference between the uptrend and downtrend line displayed as the main histogram.
If the uptrend line is greater than the downtrend (thus indicating positive movement), then the histogram bars will be either light green or dark green. If the uptrend line has just now crossed the downtrend line, then the bar will be dark green. Bars will also be dark green when the uptrend line is greater than the downtrend line and the uptrend line is increasing. This means the trend is increasing in strength still. If the uptrend line is greater than the downtrend line, but is decreasing, then the bars will be light green. This means that the upwards trend is losing strength.
If the downtrend line is greater than the uptrend line, then there is a negative trend occurring and the bars will be either red or light red. If the downtrend line has just crossed over the uptrend line or is increasing in value, then the bar will be red. If the downtrend line is greater than the uptrend line, but is decreasing in value, then the bars will be light red (meaning the downtrend is weakening).
One way to trade using this vortex is to enter a long position when the bar color changes from red to light red. This would mean that the downtrend is decreasing in strength and an upwards reversal is likely to occur soon. Then, traders can exit their long position when the bars change from dark green to light green. When that color change occurs it means that the uptrend is running out of steam and price is unlikely to continue its upwards climb.
Traders can also choose to have the uptrend and downtrend lines plotted as well in the input menu. This may make it easier to visualize the Vortex and its usefulness in identifying reversals.

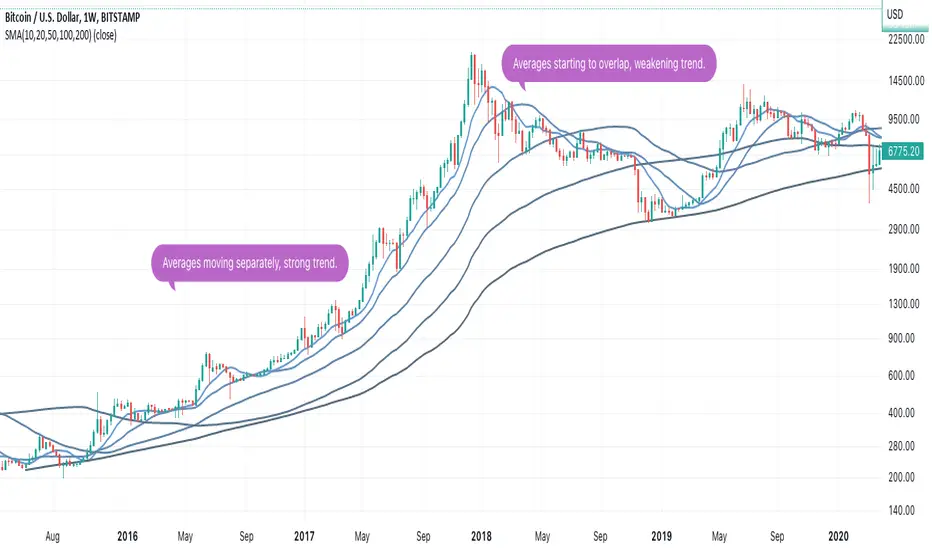
SMA 50 collectorHello traders
The SMA 50 is known to define a trend. If price is closing above, trend is bullish, if below, trend is bearish.
That's why I like to have all of them on my chart :)
Enjoy
David

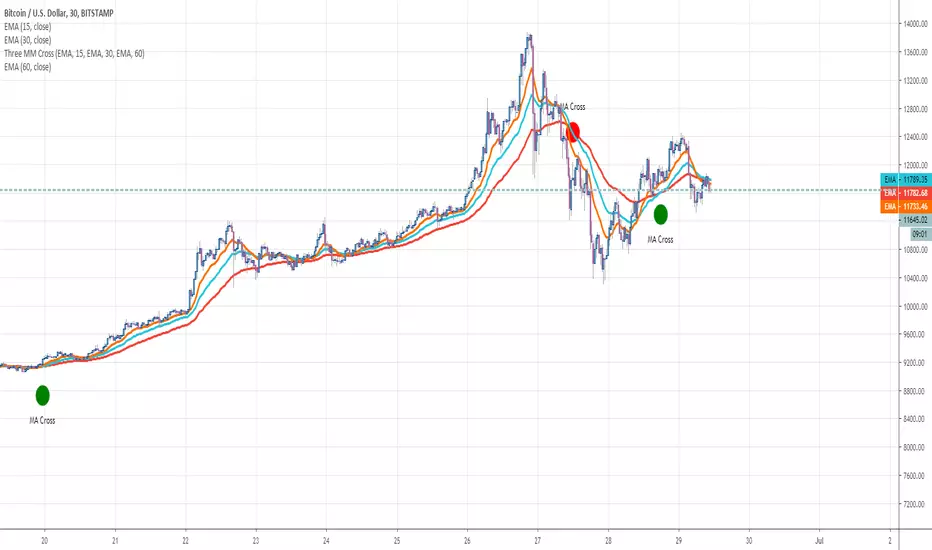
Three MM CrossHello traders
Some friends asked me to do it so... sharing it for everyone instead
This indicator detects when the first moving average is above the two others. It's a very powerful tool for trend traders that use multiple moving averages to detect a strong trend
Enjoy
Dave
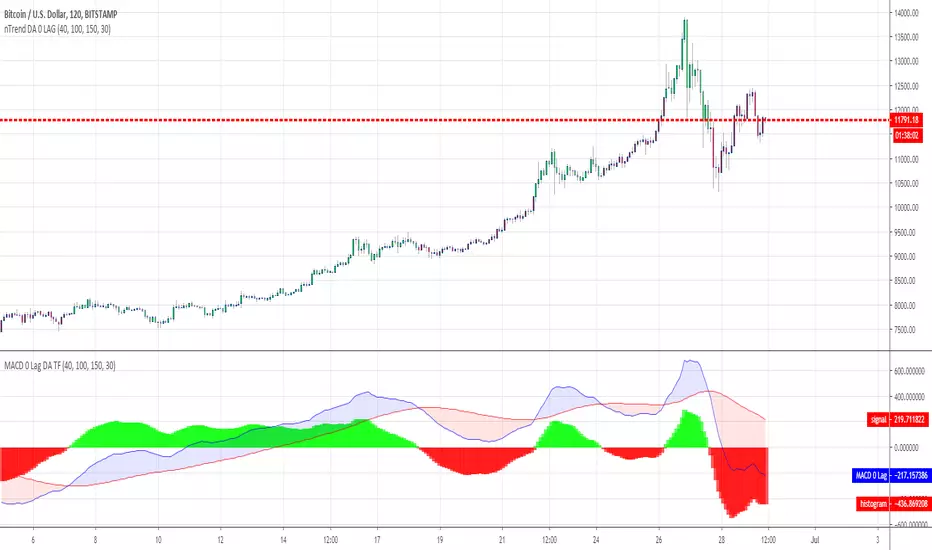
nTrend MACD Zero LAGHello traders
This indicator is to color the candles based on a MACD Zero LAG
Just wanted to show that removing the noise from the candles natural coloring could be very helpful to determine a trend and stay focused
Enjoy
Dave
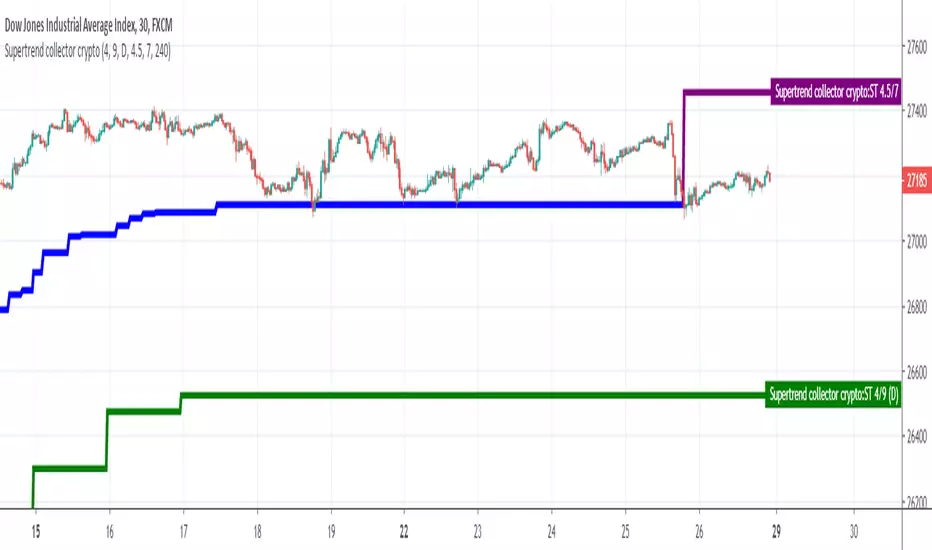
Supertrend collectorHello traders
This is an example of how you can add multiple indicators into a unique one
In this instance, I added two supertrend multitimeframes and draw them on a different timeframe chart
Enjoy
David
AntiRekt Trend OscillatorWhen the indicator value is above the horizon line the trend is up, below the trend is down. Watch out for ranging markets.