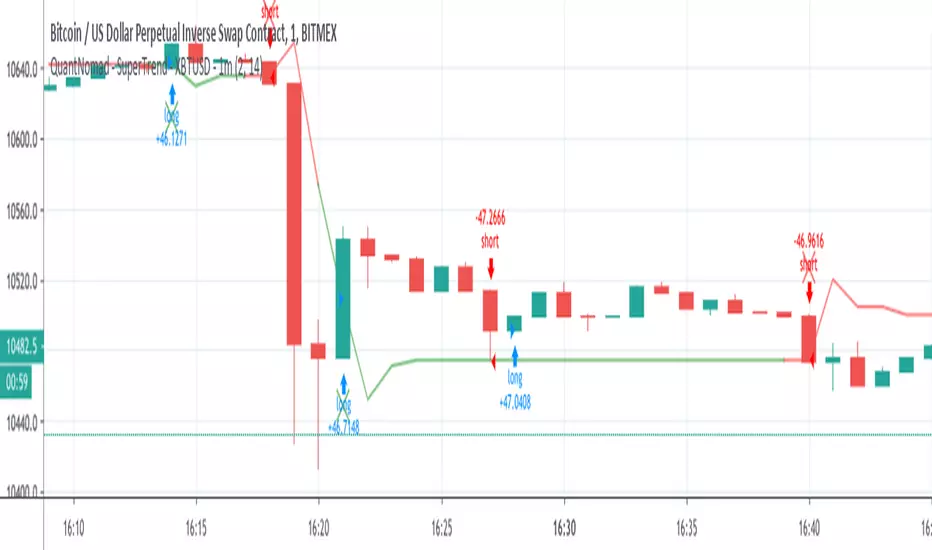
QuantNomad - SuperTrend - XBTUSD - 1mInteresting performance for Super Trend strategy for XBTUSD 1m chart.
Params: ST Mult: 2, ST Period 14.
Performance: 144% profit, 1988 trades, only 41% prof, 2.04% dd , 2.51 Sharpe.
On its own, it might be not a very good strategy, but the big amount of trades allows you to add more filters and improve it.
And remember:
Past performance does not guarantee future results.
Trend
QuantNomad - SuperTrend - TSLA - 1mInteresting performance for Super Trend strategy for Tesla ( TSLA ) 1m chart.
Params: ST Mult: 3, ST Period 120.
Performance:61% profit, 637 trades, only 33% prof, 4.84% dd , 0.4 Sharpe.
On its own, it might be not a very good strategy, but the big amount of trades allows you to add more filters and improve it.
The strategy is not bad both with "when" params when strategy executed on open of next bar and with stop orders when strategy enters on exact Super Trend level.
You can comment/uncomment lines in the code and switch from one approach to another.
And remember:
Past performance does not guarantee future results.

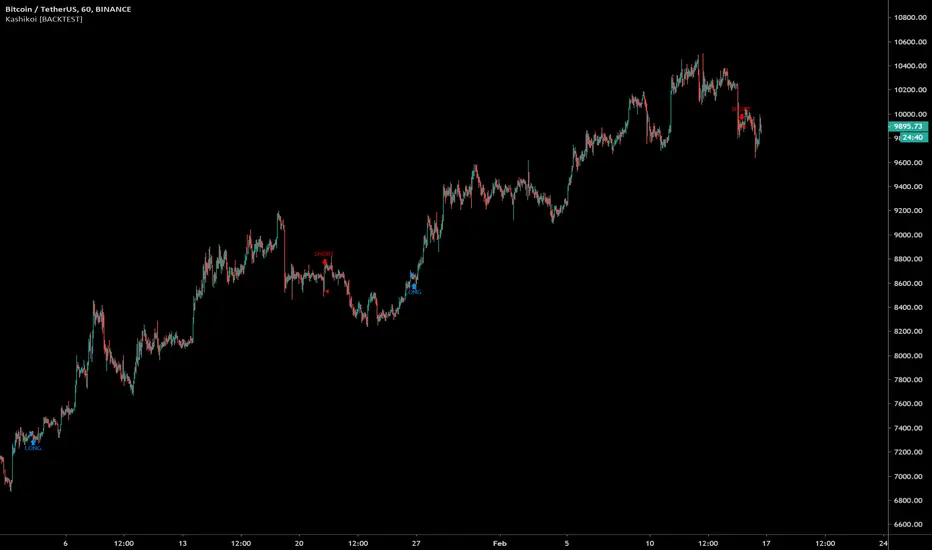
Kashikoi [BACKTEST]🔰 Kashikoi Anaraiza BACKTEST
📌This indicator is a tool to backtest the Kashikoi Anaraiza indicator which has the alerts. To see which custom strategies, indicators, settings, TP/SL performed in backtest.
📌Can test any combination of indicators and settings
🔹Trend Analyzer - Trend Reversals
🔹RyuKumo - BULL / BEAR
🔹EMAs / MAs
🔹Ichimoku - Breakouts / TK Crosses
🔹Breakouts S/R
🔹Pullbacks
🔹MACD
🔹RSI
🔹Stoch RSI
🔹Custom TP/SL %
🔹Trailing Stoploss
🔹Will add more features in future updates and as requested
📌Note: This is a tool to test various settings, to find optimal timeframes, TP/SL %, strategy parameters and testing. Which can save time from tediously manually testing. Past performance is not indicative of future results.
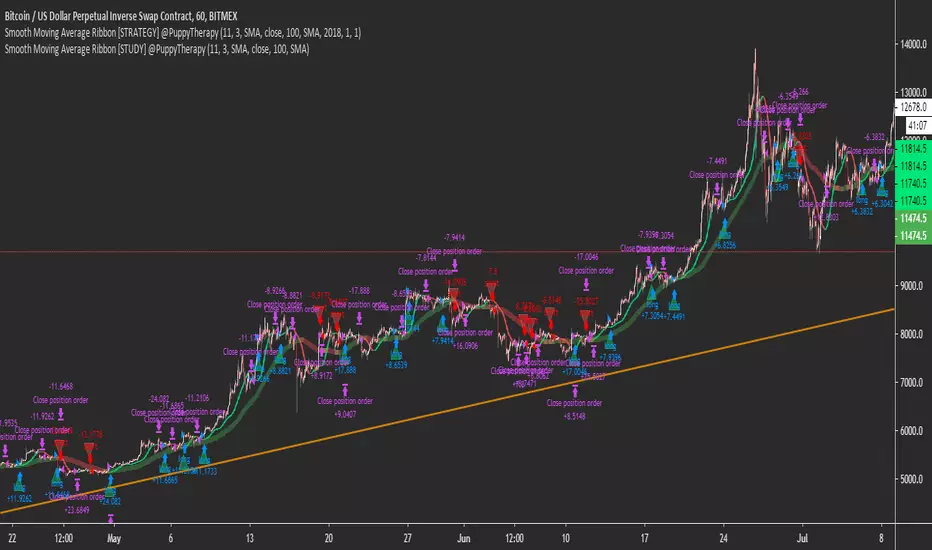
Smooth Moving Average Ribbon [STRATEGY] @PuppyTherapyThe Smooth moving average ribbon script is an enhancement of the script I posted yesterday. But will help you also create a very simple trend-following strategy or a simple trend-following filter.
You are able to select from a large variety of moving averages add Heikin Ashi Candles as a source and also add additional smoothing to every single of the moving averages.
The Strategy is using the basic backtesting engine.
It is a showcase that a simple strategy like buy when we going up and sell when we going down actually works especially on a bigger timeframe.
Thanks to all supporters and everget for some of the moving average scripts.
Smooth Moving Average [STRATEGY] @PuppyTherapyThe Smooth moving average script combo combines the ability to help you create a very simple trend-following strategy or a simple trend-following filter.
You are able to select from a large variety of moving averages add Heikin Ashi Candles as a source and also add additional smoothing to every single of the moving averages.
The Strategy is using the Tradingview backtesting framework.
It is a showcase that a simple strategy like buy when we going up and sell when we going down actually works especially on a bigger timeframe.
Thanks to all supporters and everget for some of the moving average scripts.

No Nonsense NNFX VP Strategy for Back Testing 3 x Indicators| jhAfter testing your individual indicators, it's time to build up your algo with additional indicators and further backtest the strategy.
Using SSL twice here, faster SSL for 1st confirmation, slower SSL for 2nd confirmation and TDFI for volume validation.
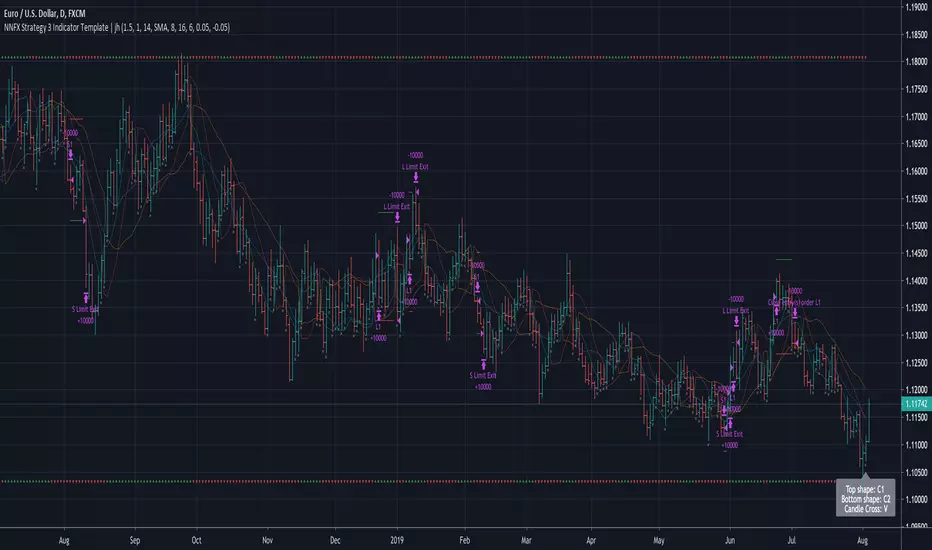
No Nonsense NNFX VP Strategy for Back Testing Indicators| jhAfter putting the whole system together, sat down to benchmark the various confirmation indicators, shrink it down to backtest individual confirmation indicators.
Results for 24 periods way better than 10, then again it's only one pair. :)
More details below.
//////////////////////////////////////////////////////////////////////////////////////////////////////////////////////////////////
//Designed per No Nonsense Forex VP rules
//For testing your individual indicators before the full system
//Originated from causecelebre
//Tried to put in as much VP rules as possible
///////////////////////////////////////////////////
//Rules Implemented:
///////////////////////////////////////////////////
// - SL 1.5 x ATR
// - TP 1 x ATR
//
// - Entry conditions
//// - Entry from 1 x confirmation
// - Exit conditions
//// - Exit on confirmation flip
///////////////////////////////////////////////////
//Trades entries
///////////////////////////////////////////////////
// - First entry L1 or S1 with standard SL and TP
///////////////////////////////////////////////////
//Included Indicators and settings
///////////////////////////////////////////////////
// - Confirmtion = SSL 10
///////////////////////////////////////////////////
//Credits
// Strategy causecelebre www.tradingview.com
// SSL Channel ErwinBeckers www.tradingview.com
//////////////////////////////////////////////////////////////////////////////////////////////////////////////////////////////////
//Change log
//First release. Testing of indicators
//////////////////////////////////////////////////////////////////////////////////////////////////////////////////////////////////

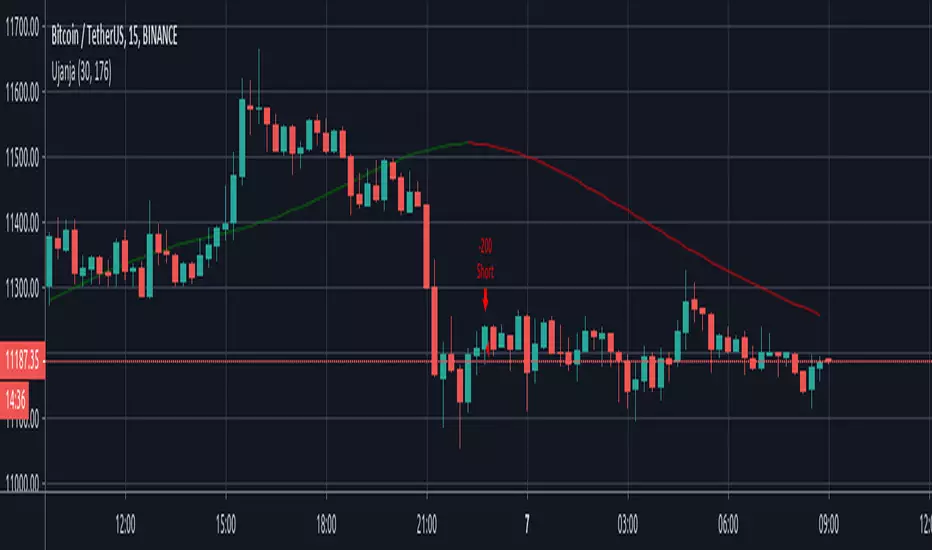
UjanjaUjanja uses Zero Lag EMA combined with Hull Moving Average for smoothing purposes. It is a less aggressive. It is only to be used with huge volume , huge momentum and high volatility to get trend analysis... It doesn't repaint at all.
Advised use :
Trades highly volatile Crypto currencies, stocks as well as Gold .
It is only to be used with huge momentum and high volatility to get trend analysis... It doesn't repaint at all.
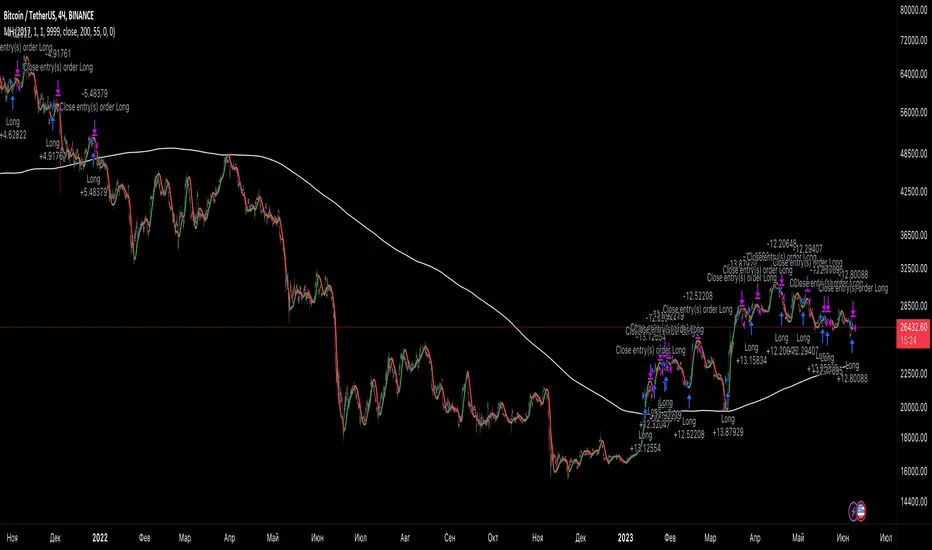
MH1) There is no "security (tickerid, 'D', close)", which has "Blue Sky day 90%", "Vdub" and etc
2) The tested values which you can see below were without "Pyramiding"
Ema BacktesterA simple, but useful script for backtesting purposes. Find the optimal Settings for your strategy.
tips are always welcome at: 38uGQJDDZDL6wX48x4gYTccPeQ3ZHVYmY4 (btc)
I hope you enjoy the script :)

Rock1) There is no "security (tickerid, 'D', close)", which has "Blue Sky day 90%", "Vdub" and etc
2) The tested values which you can see below were without "Pyramiding"

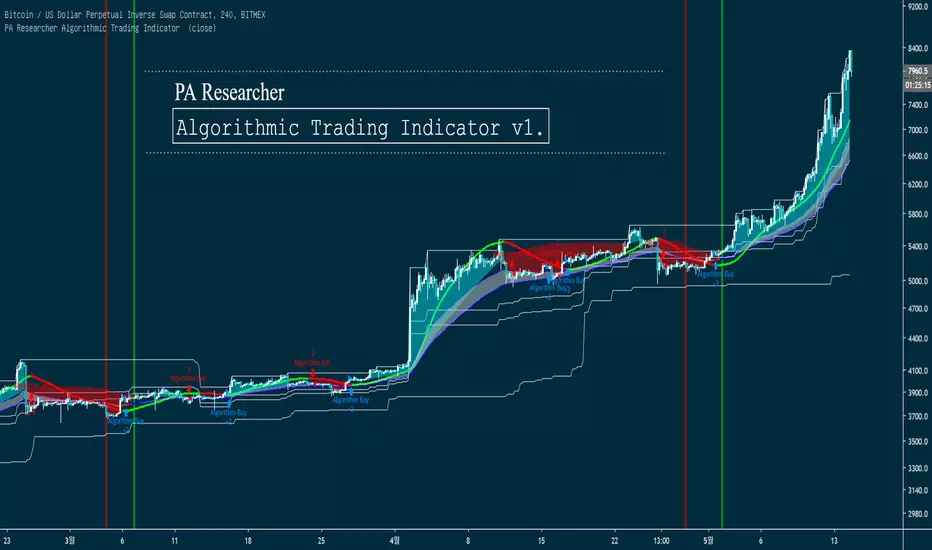
PA Researcher Algorithmic Trading Indicator PA Researcher Algorithmic Trading Indicator v1.
This Indicator is Algorithmic Trading Indicator.
Provide Best Buy/Sell Time & Good to check Long/Short term Trend For Swing/Scalping
Easy Trend Analysis for Beginner
Ability to Turn ON/OFF each Indicators
Ability to Change Colors
#This is not a Auto-Bot, This indicator Provide the Best Enter Time
-----------------------------------------------------------------------------------------------------------
PA Researcher Algorithmic Trading Indicator v1. 입니다.
자동화된 추세 분석을 통해 단/중/장기적인 추세 분석을 나타내주며,
알고리즘 값에 충족할 시 매수/매도 시그널이 나타납니다.
추세분석을 매우 쉽게 나타내며, 원웨이를 잡기에 매우 좋은 진입 시그널이 발생됩니다.
무엇보다, 추세변곡을 엄청나게 잘 잡아냅니다.
그 어떤것보다 시각적인 요소를 중요시 했기 때문에, 사용법을 잘 모르시는 분들도 쉽게 사용하실 수 있습니다.
Ex_)
Hit ratio example
적중률은 이 사진 한장으로 설명됩니다.
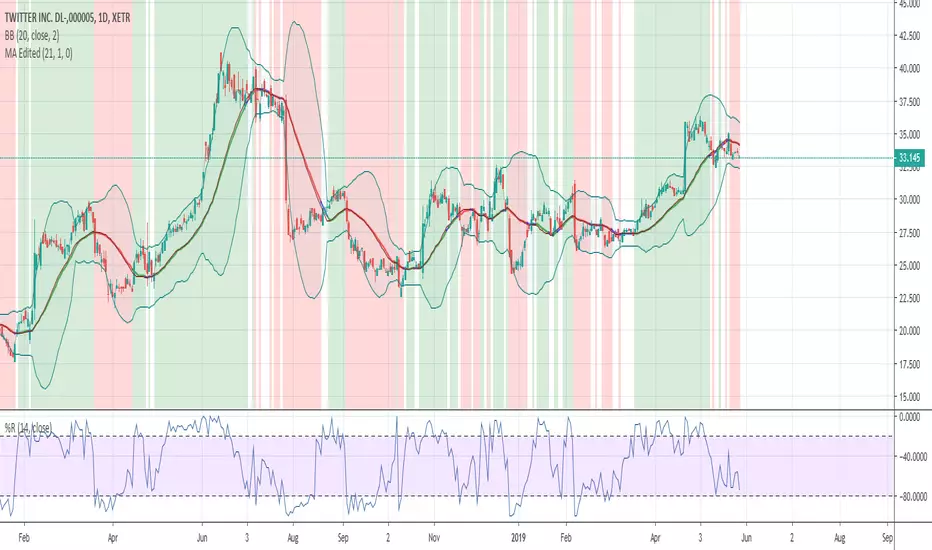
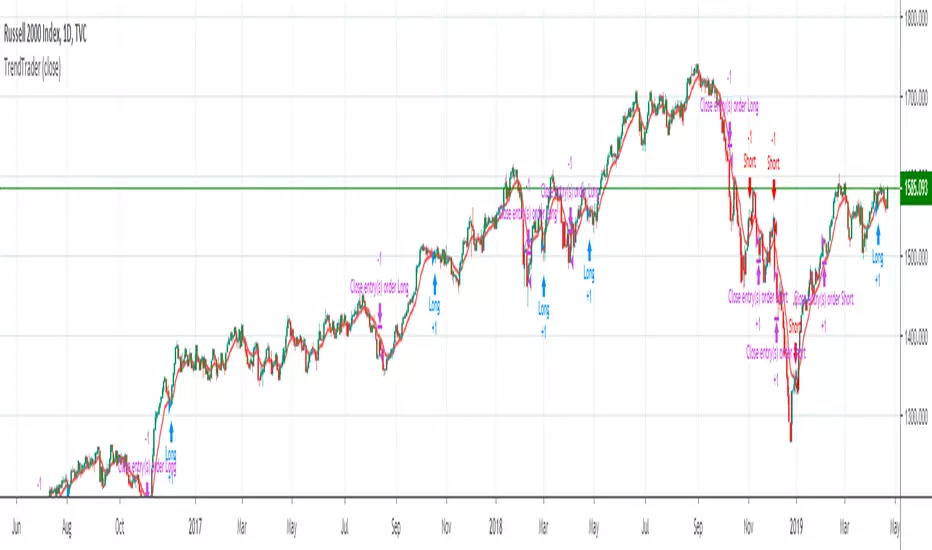
Trend Trader (by JamieSteele)This strategy uses a multi-time-frame approach to trading.
A longer-term set of moving averages represents the Weekly (long-term) Trend.
The current trend represents the intermediate-term trend.
A 10 period exponential moving average represents the short-term trend.
The system trades in the direction of the long-term and intermediate term trend,
and enters trades on pullbacks counter to these trends.
The daily bars are colored based upon their intermediate term trend.
Red=Down Trend, Green=Up Trend.
For short-side trades, we look to capture small, consistent profits. This is necessary
given the extreme manipulation by governments' central banks in an effort to prop-up their
stock markets to give an appearance of an economy that is better than actually exists.
These governments look to limit all downside moves, so we capture small profits and then
re-short after the market resets.
For long-side trades the system stays in the trade until the trend is proven to be over.
Given the extreme valuations present in world markets today, extreme caution should be taken
on all trades, especially long-side trades. Use of derivatives are preferred (e.g. options,
which can be used to limit downside risk.) Naked put selling should be avoided, since huge
losses are possible selling naked puts in a market that is very overdue for a crash/large
price decline.)
The Rocket : Profit Factor [Bradford_Fournier]The Rocket
I hope this helps you as much as it has me.
Suggestions:
Use with tech stocks with reasonably high volatility
Time-frames are flexible but a 1-3month window is best.
REQUEST: If you find this useful, please let me know. I'd like to improve this script further. Any suggestions or encouragement are greatly appreciated
The rocket is based on my Trend Shift Indicator. Please take a look if you haven't yet.


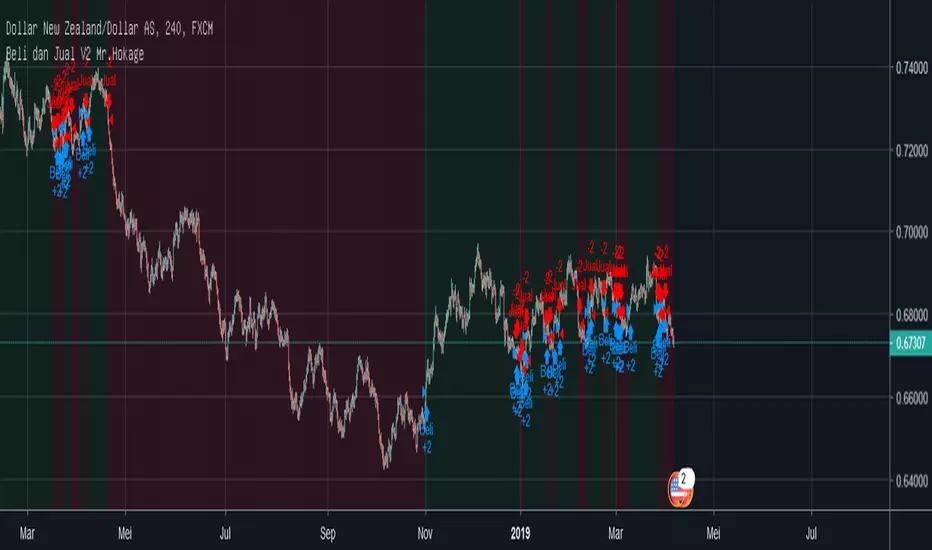

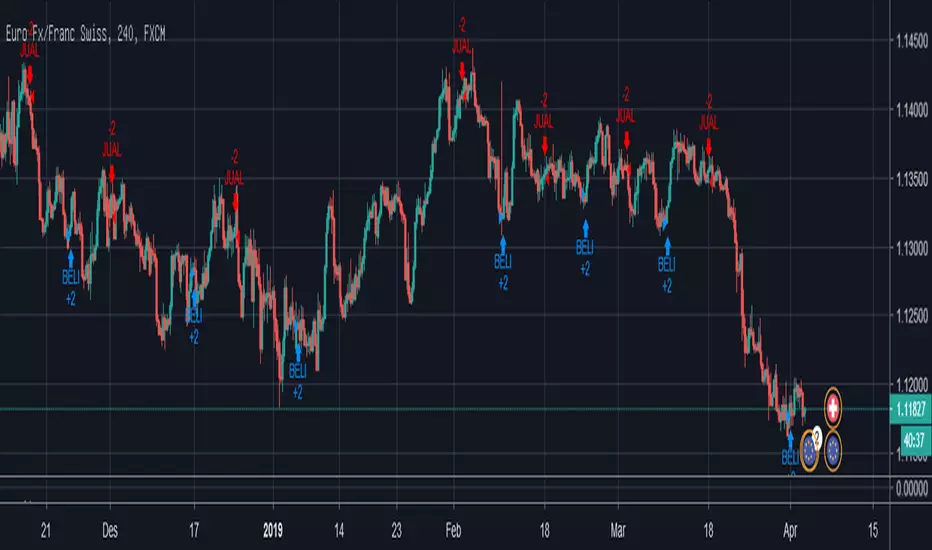
Profit Maker Mr.Hokage V1Tinggal ikuti arahnya gunakan Time frame 4H bisa di gunakan di crypto,Forex,Saham dan lain lain
Hucklekiwi Pip - HLHB Trend-Catcher SystemThe strategy was authored by Hucklekiwi Pip back in 2015 and is still being updated today. She says that the system was designed to simply catch short-term forex trends. At its heart, the system is a simple EMA crossover strategy with a couple of other indicators used for confirming entries.
Strategy Rules
See her original post here:
www.babypips.com
Be sure to check out the updates and tweaks over the years!
HOW TO USE
For full information on how to use this strategy and how to correctly set the exit time, see this post:
backtest-rookies.com

Momentum fader 1.0The strategy is based on a momentum gauge designed for lower timeframes. In the current iteration, trades are very conservative and closed quickly.
In a future version, I've planned to implement dynamic take profit and stoploss levels for ultimate accuracy and maximized profit:drawdown ratio.
The strategy is specifically made for ETH and works best on the 3-minute timeframe.
Enjoy!

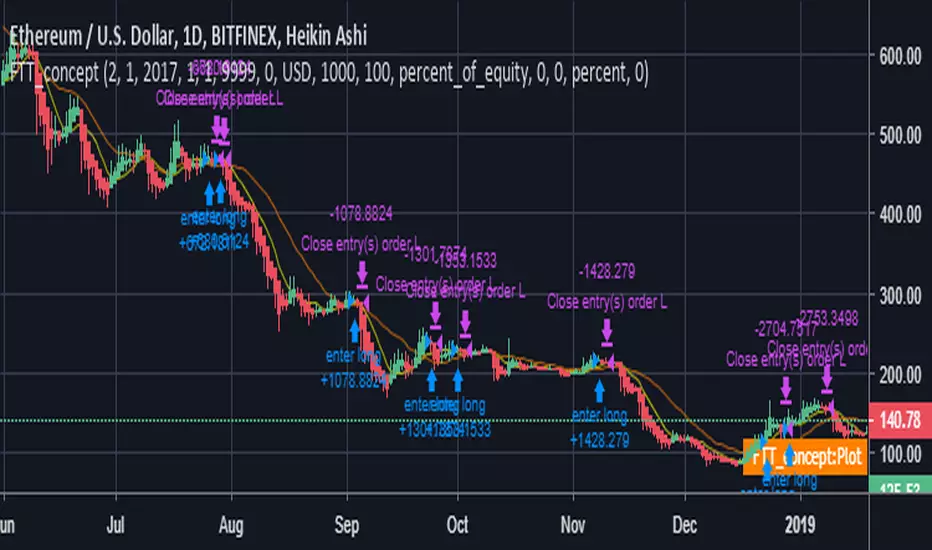
FTT_concept HTFTrend following Strategy utilizing Heikin Ashi candles. Best results at higher time frames (12H+). I personally prefer 1D TF.
Cheers
Tip box
BTC: 3FMew3LkwAf5x6K3qjT9Tp3pXNFCWKgEfT
ETH: 0xC72d4128f95E1759FdbF027F412E794b62fBBbE8
LTC: LQts3ypPKodNpmQGpPRMZhFaH3yhyDw7iL
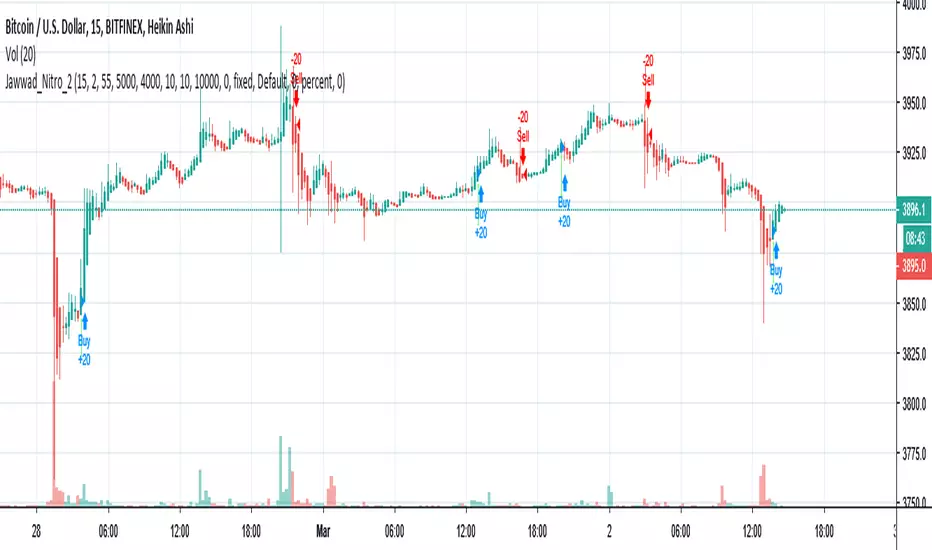
Jawwad Nitro_2 Crypto Forex Strategy - Highly ProfitableThis strategy is tested on selected crypto and forex pairs. It seems to be highly profitable and non-repainting. You can make some good money until you are following it properly and not playing with the settings.
1. Use 15 minute Heiken-ashi chart.
2. Apply the strategy.
3. Enjoy!!!
If this strategy works for you, please don't forget to buy me a cup of coffee... If you find anything wrong, please let me know. I shall be happy to fix it for you.
Cheers,
Jawwad