CrayonsCrayons Grayons
Derived from -
Its messy and experimental until stable version is released , now for testing purposes only
Trends
AC_TrendsA script to unique identify major trends , entry with white circles and exit when red or green bars ends. Use with other indicators like Bollinger bands , macd , rsi etc.

Quantum Trend MonitorCurrency pairs never go up or down in a straight line. They rise and fall constantly, creating pullbacks and reversals. And with each rise and fall, so your emotions rise and fall. Hope, then fear, then hope again. This is when the market will try to frighten you out of a strong position. It is when you are most vulnerable.
But not if you have the Quantum Trend Monitor. And here, you get two indicators for the price of one!
The Quantum Trend Monitor has been designed to absorb these temporary pauses and pullbacks. It analyses the price action, and only changes to a transitional color of dark red or dark blue, if the trend is showing a temporary sign of weakness. If it is a true change in trend direction, the indicator will change to a bright color, as the new trend develops.
In other words, the Quantum Trend Monitor, does just that. It monitors the strength of the trend. This is displayed as a solid horizontal bar at the bottom of the screen. The trend monitor works in conjunction with the Quantum Trends indicator, helping to keep you in – guess what – the trend. One of the hardest things to do in trading. But, with the Quantum Trend Monitor, it’s a breeze. We call it, ‘the profit generator’, as that’s exactly what it is. It will help you hold any position for longer periods, maximising your profits. No more closing out early and suffering from trader regret. No more emotional trading decision. Just watch your Quantum Trend Monitor, which….. monitors it for you.
The Quantum Trend Monitor displays four colours at the bottom of the screen as a solid bar:
Bright blue – strongly bullish trend
Bright red – strongly bearish trend
Dark blue – weakness in trend
Dark red – weakness in trend
First, the Quantum Trends indicator alerts you to a possible new trend. If the trend is strong, the Quantum Trend Monitor will change to either bright blue or bright red, supporting the Trends indicator as the trend develops.
Used in conjunction with a multiple time frame approach, it is the indicator which will really make ‘the trend your friend’. Now you will be able to monitor the trends in multiple timeframes in real time, reducing risk, improving returns, and increasing your overall profitability.
The Quantum Trends create the signal, its sister indicator the Quantum Trend Monitor then kicks in. Together, these two indicators provide you with the perfect tools to manage your position. No more fear, no more doubt, no more uncertainty. Watch your trading account grow, as you allow your profits to run – with confidence!
And guess what – it doesn’t end there.
Remember we said you get two indicators for the price of one here! Well, to help you further, the Quantum Trend Monitor comes with its own unique trend line, which gives you a further ‘heads up’ on the trend. For clarity and simplicity, this indicator overlays the Quantum Trend Monitor and appears as a yellow line. The line chart shows the momentum of the trend and works as follows:
If the yellow trend line is above the zero line, there is a bullish trend in place
If the yellow trend line is below the zero line, there is a bearish trend in place
When the yellow trend line crosses the zero line, the trend has reversed
The further the yellow trend line gets from the zero line, the greater the strength and momentum of the trend
As the old saying goes – two heads are better than one. Here we could say – two indicators are better than one. Now with the Quantum Trend Monitor and the yellow trend line, you have a complete picture of the trend. Staying in and maximising your profits has never been easier.
And finally.. this is the next generation of TradingView indicators and virtually all our indicators can be configured to suit your own trading style. Why? Well, you buy everything else to suit you and your personality – from clothes to cars – so why not trading indicators? After all, as a scalping forex trader you will have different requirements to a swing or trend trader. You wouldn’t buy clothes that don’t fit, so why put up with indicators that cannot be configured. Simple.
One size fits all does not apply – in our view!
So, just like our other indicators, the Quantum Trend Monitor can be ‘tweaked’ to suit your trading style – the benefits are self-evident. Your trading consistency and profits will improve. After all, you are now using tools matched to the job. Precision trading requires precision tools and fine tuning. Don’t make do with second best.
With the Quantum Trend Monitor, you are in control. Just like the volume control on your radio, you adjust the sensitivity of the indicator to suit your trading style. Turning up the sensitivity a little alerts you earlier to periods of congestion – important if you are purely scalping. Turn it down a little, and this will smooth out these phases and keep you in those longer term trends for maximum profits.
The two indicators work in all timeframes.
Getting in is easy – staying in is hard. With the Quantum Trend Monitor and the associated trend line, staying in becomes easy too!

MSignal Trend Continuation Indicator Msignal Trend Continuation Indicator
Alerts continuation trading patterns and signals trades that take advantage of price action turning points.
It seeks to find near term support and resistance levels and then identifies places on the chart to entry, and take profit of the established short term trend.
The indicator is based in price action and market timing algorithms to determine these turning points at significant price levels in the markets.
That way, you can be sure you have chance to enter in the market at the best level of the trend and take a high probability trade and ride the best part of the trend.
Once the MSignal indicator has spotted a continuation pattern, it clearly displays a Buy or Sell signal on your chart, showing you exactly where possible entry to continue with the trend.


Trend Detector IndicatorTrend Detector Indicator
Class : trend oscillator/average analysis
Trading type : trading in trend
Time frame : 1 day
Purpose : trend detection
Level of aggressiveness : conservative
The key problem of trend following trading is danger of entering into position at extreme points of the trend with further trend reverse. Plus in any case it is very important to understand the phase of the trend cycle to be effective and successful trader.
Each trend can be divided into several phases: start of the trend, active development, consolidation phase, end of the trend. Obviously the most interesting phases for trading in trend are start and active development of the trend. At these phases risk of unsuccessful trading in trend direction is minimal, but profit opportunities are maximal. Still as a rule it is quite hard to detect the start of the trend. As the result probability of false signals is rather high.
Indicator «Trend Detector Indicator» is developed to identify the active phases of the trend cycle and helps to avoid trading at the end of the trend.
Using unique algorithm Indicator “TDI” allows to identify moments in price dynamics which are the most appropriate for trading in trend.
Structure of the indicator
Indicator consists of the TDI line and special colored zones:
- TDI line (multi-colored line in the indicator window) – is used to divide phases of the trend cycle, different colors signal about current type of price dynamics (blue color – uptrend, red color – downtrend, green – flat);
- Colored zones (blue, yellow and red colors depending on type of the signal) – are used for color indication of the trend cycle phases. Blue color means that trend is in active phase. Yellow warns about possible transition of the trend to the extinction. Entering the red zone is a signal of possible break of a trend.
Input parameters of the indicator
To set up the indicator a number of input parameters are used:
- Average period – averaging period. Responsible for the data filtration (by default = 13). The bigger the period is the less quantity of the signals would be, but the higher their quality is expected. Decrease of this parameter allows to increase the aggressiveness of the trading and the number of generated signals, but potentially this can decrease the quality of the signals
- Correlation period – period which is used in correlation analysis to calculate the correlation moment (by default = 21).
Rules of trading
Entering of the TDI line into blue zone and being there is a signal for active trading in current price direction. The direction of the tendency is indicated by the color of the TDI line: blue color – uptrend and “buy” signal, red color – downtrend and “sell” signal, green – flat, that means there is no dominating tendency and trading in trend should be postponed.
Since the basis for the trades are trend signals, their closing with profits or stops should be done when these signals lost relevance. So stop-loss and take-profit parameters are not provided. Such approach allows to avoid profit limitation by a certain number of points and to extract maximum from the active phase of the trend cycle, which is not limited in theory.
Change of the TDI line color in blue zone is a signal to close current long positions. Exit of the TDI line from blue zone is a signal to close current trend positions.

Draculapresley Daytrading STRAT O' DOOM 1.3Very excited with my results after extensive testing I present the Strat O Doom version 1.3!
Using some custom settings with a few indicators and a custom movement algorithm I have fine tuned my strat even further. The strat now lends itself to quick trades but also better at finding longer movements as well.
I appreciate everyone participating and engaging with my last version and anyone who has donated will get access to the new settings!
For access please consider a donation...
BTC
19sbyzKm9PqYizeFgTkT1gSRvyfBNa2bn7
ETH
0x6b8ef9f4979df6efd51e745ba996299349d67306
LTC
LLMUH5v5DeurLZEeX2Atu9W36vLA1pTX7o
For donation confirmations or script purchase you can email draculapresley@gmail.com

DepthHouse Relative Momentum Range OscillatorDepthHouse Relative Momentum Range Oscillator uses several calculations between the relative momentum and range to help determine trend direction and strength.
Breakouts above the adjustable horizontal zone often serve as a bullish confirmation, while breakout below the horizontal zone often serve as a bearish confirmation.
Crosses of gold and yellow signal line represent trend consolidation and/or possible reversal zones.
How to get:
As you can see this is an invite only script. In the coming month this indicator, along with many others will become pay to use only. (website on my profile page)
However all my indicators will be FREE until May 1, 2018 . So please try them out!
To take advantage of this FREE trial :
1. Leave comment on this indicator post! Maybe even give me a follow :D
2. Check out and take advantage of all my other indicators!
I hope you all enjoy!
Notes:
Signals Beta:
Both functions give possible buy and sell signals shown by the circles in the middle. The strength of the signal is shown by the circle size. The larger the circle, the stronger the signal.
This feature is in beta testing is not advised to trade off of.
Altering the Multi-Factor will adjust the dotted signals at the bottom.
This is a heavily modified version of my DepthHouse Envelope Oscillator

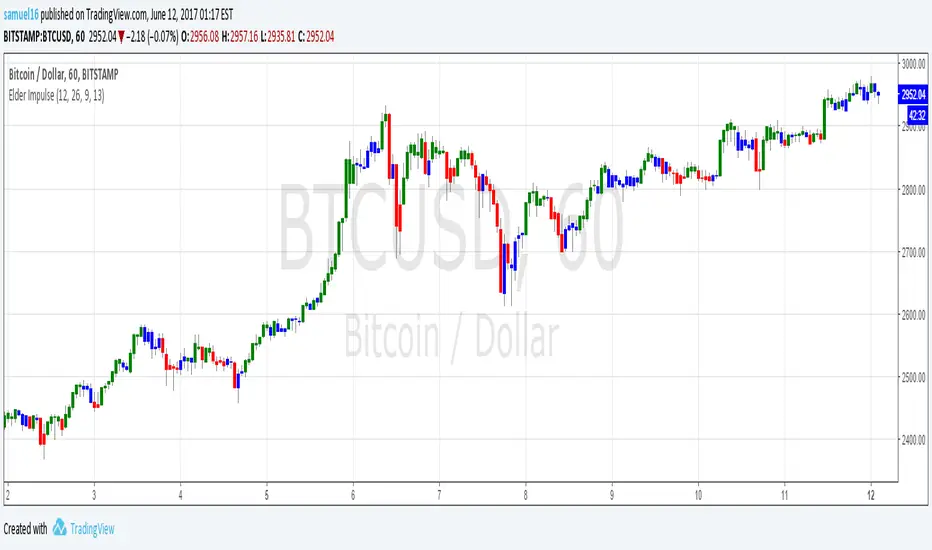
Elder Impulse SystemQuickly Identify Trends with the Elder Impulse Indicator.
Pretty much the same as , but written from scratch to be simpler to use and the source code easier to read (no offense, LazyBear)
For more info, see stockcharts.com
UltraTrends.V2This is version 2 of Ultratrends.
Like the last version:
Fuschia is pivot down, yellow is pivot up, up is confirmed up, down is confirmed down, green is uptrend, red is downtrend, gray is no trend.
"UP" Is a good indication that the market is going to go up. "DOWN" is a good indication that the market will go down. However, use your head. Think about support / resistance.
Additions:
- 200 EMA/SMA Average (Thick aqua line): Great for determining trend and acts as support / resistance.
- 50 SMA (thin yellow line): Use for 50/200 crosses to determine trend. Serves as weaker resistance.
- Dynamic Pivot points (by finn): Serve as support / resistance levels. Plotted as horizontal dots.
- Early move detection: demonstrated by either a green triangle below bar or red triangle above bar.
- "Hot Zones": volume based background highlighting the manifestation of bullish conditions. Default color is white, so if you use a lighter background, please change it to another color.
This indicator works best with 1337 Volume:
The only way to get this script is by joining Gambit Private Trading Room. There are currently ~ 90 experienced traders in the room at the time of this post that share the best ideas / setups. For more information, please fill out the form at: GambitCrypto.com
Enjoy

MM-Burj Khalifa IndicatorThis indicator uses several signals to visualize a "perfect candle" to enter a trade.
It colors the background to identify the zones of interest (multiple configurable high or low RSI zones). Underlying is a trendbar with the current MACD direction.
The indicator is using signals of:
--MACD
--RSI
--PVT
--ATR
--AD and DMI+/DMI-
When all 7 criterias are met it highlights the candle.
It also creates different colums with different height and width, so that you can see which signal is OK and which is maybe missing. When all signals are on GO you'll see a Burj-Khalifa-like figure. If not all signals are on GO you'see crippled versions.
To be clear:
it's not intended to detect trends or supertrends or reversals. It's purpose it's just to decide if this current candle is really going in the right direction.
The Burj-Khalifa indicator could help to confirm the entry point of an trade which was already planned.
