RTH & ETH VWAPs (Unified Style)AVWAP indicator showing only the current session. Shows ETH VWAP even when RTH is turned on. Has standard deviation and fills for settings.
Vwapbands

VOLX+ VWAP Range BandsVOLX+ plots multiple VWAP-weighted high/low channels across different lookback periods to show how price behaves relative to short-term and long-term value zones.
Instead of using a single VWAP line, this tool creates four rolling VWAP envelopes:
Short-term range (fast reaction)
Mid-term range
Mid-mid range (transitional layer)
Long-term range (macro context)
Each band is computed as:
VWAP-High = SMA(high × volume, length) ÷ SMA(volume, length)
VWAP-Low = SMA(low × volume, length) ÷ SMA(volume, length)
This produces dynamic price channels that account for both price and traded volume, offering a clearer sense of where the market is accepting or rejecting value.
What It Shows
Four VWAP-weighted high/low bands
A short-term VWAP midline
Price line
Three SMAs for trend context
Optional visibility switches for each VWAP band
The filled regions between VWAP highs and lows create a layered “value map,” helping you interpret:
Trend continuation (price hugging outer VWAP bands)
Mean reversion (price returning toward inner bands)
Volatility contraction/expansion
Shifts in short-term vs long-term balance
🧠 How to Use
Use the short-term band for day-trading context or detecting short-term excess.
Use mid-term and mid-mid bands to confirm developing structure.
Use the long-term VWAP band to understand broader value zones.
Combine VWAP bands with SMAs and structure analysis for confluence.
This indicator is intended for price interpretation and analytical support.
✔ Does Not Repaint
The script uses rolling VWAP formulas and standard MAs; everything is stable and non-repainting.

Session VWAPs [cryptalent]This indicator provides a more granular and timely analysis of market structure compared to traditional daily Volume Weighted Average Price (VWAP). It splits the 24-hour trading day into four distinct, customizable sessions (T1, T2, T3, T4), calculating an independent Session VWAP and Standard Deviation Bands for each segment.
🌟 Key Features and Functionality
1. Segmented VWAP Calculation
Purpose: To track the true Volume Weighted Average Price (Fair Value) specific to the participants and trading activities within different global market sessions (e.g., Asian, European, US sessions).
Design: By default, the 24 hours (based on UTC time) are divided into T1 (00:00-06:00), T2 (06:00-12:00), T3 (12:00-20:00), and T4 (20:00-00:00).
Mechanism: The VWAP calculation resets at the start of each designated session, offering a clearer, segment-specific view of market consensus and volume absorption.
2. Standard Deviation Bands
Calculation: Each Session VWAP line is accompanied by upper and lower standard deviation bands.
Control: The width of these bands is controlled by the user input "Band Multiplier" (default is 1.0, representing one standard deviation).
Application: These bands measure the Volume-Weighted Volatility and define the expected "normal" trading range for the current session.
- Price within the bands suggests consolidation or a normal auction process.
- Price breaking out of the bands indicates strong directional momentum or an extreme/overbought/oversold condition for that specific session.
3. High Customization (User Inputs)
Session Timing: All four session start and end times (in UTC) are customizable, allowing traders to align the indicator with specific market hours or individual trading strategies.
Price Source: The source price used for the VWAP calculation is selectable (default is close).
💡 Trading Applications
1. Fair Value Identification: The VWAP line serves as the "Fair Value" or "Volume-Weighted Consensus Cost" for the active session.
Price above VWAP: Buyers are in control during that session.
Price below VWAP: Sellers are in control during that session.
2. Dynamic Support & Resistance: Both the VWAP and the Standard Deviation Bands often act as reliable dynamic support and resistance levels.
3. Volatility Assessment: The width of the bands reflects the volume-weighted volatility of the current session. Narrow bands suggest range-bound trading; wide bands imply strong directional activity.
4. Trend Strength: Sustained price action outside of the standard deviation bands is a key measure of the strength and commitment behind a current trend.

Tactical Deviation🎯 TACTICAL DEVIATION - Volume-Backed VWAP Deviation Analysis
What Makes This Different?
Unlike basic VWAP indicators, Tactical Deviation combines:
• Multi-timeframe VWAP deviation bands (Daily/Weekly/Monthly)
• Volume spike intelligence - signals only appear with volume confirmation
• Pivot reversal detection at deviation extremes
• Optional multi-VWAP confluence system
• Smart defaults for quality over quantity
This unique combination filters weak setups and identifies high-probability entries at extreme price deviations from fair value.
📊 DEFAULT SETTINGS (Ready to Use)
✅ Daily VWAP with ±2σ deviation bands
✅ Volume spike detection (1.5x average required)
✅ 2σ minimum deviation for signals
❌ Weekly/Monthly VWAPs (enable for multi-timeframe)
❌ Pivot reversal requirement (enable for stronger signals)
❌ Fill zones (optional visual enhancement)
Why: Daily VWAP is most relevant for intraday trading. 2σ bands catch meaningful moves. Volume spikes ensure conviction. Clean chart focuses on what matters.
🚀 HOW TO USE
BASIC USAGE:
• Green triangles (below bars) = Long signals at oversold deviations
• Red triangles (above bars) = Short signals at overbought deviations
SIGNAL QUALITY:
• Normal size, bright colors = Volume spike (best quality)
• Small size, lighter colors = Volume momentum
• Tiny size = No volume confirmation
DEVIATION ZONES:
• ±2σ = Extreme deviation (signals appear here)
• ±1σ to ±2σ = Extended but not extreme
• Within ±1σ = Normal range
TRADING APPROACHES:
Mean Reversion:
→ Enter when price reaches ±2σ with volume spike
→ Target: Return to VWAP or opposite band
→ Stop: Beyond extreme deviation
Trend Continuation:
→ Use bands to identify pullbacks
→ Enter pullback to VWAP in trending market
→ Volume confirms continuation
Reversal Trading:
→ Enable "Require Pivot Reversal" for stronger signals
→ Signals only when deviation + pivot reversal occur
→ Higher probability, fewer signals
⚙️ EXPLORE SETTINGS FOR FULL USE
VWAP SETTINGS:
• Show Weekly/Monthly VWAP = Multi-timeframe context
• Show ±1σ Bands = Normal deviation range
• Show ±3σ Bands = Extreme extremes (rare but powerful)
SIGNAL SETTINGS:
• Min Deviation: 1σ (more signals) | 2σ (default) | 3σ (fewer, extreme only)
• Require Pivot Reversal: OFF (default) | ON (stronger but fewer)
• Volume Spike Threshold: 1.5x (default) | 2.0x+ (major spikes) | 1.2x (more signals)
CONFLUENCE SETTINGS:
• Require Multi-VWAP Confluence: OFF (default) | ON (2+ VWAPs must agree)
• Min VWAPs: 2 (Daily + Weekly/Monthly) | 3 (all must agree)
VISUAL SETTINGS:
• Show Fill Zones = Shaded areas between bands
• Fill Opacity = Transparency adjustment
• Line Widths = Customize thickness
💡 PRO TIPS
1. Start with defaults, then enable features as you learn
2. Volume spike requirement filters weak moves - keep it enabled
3. Enable Weekly/Monthly VWAPs for higher timeframe context
4. Enable confluence for swing trading setups
5. Pivot reversals: ON for reversals, OFF for continuations
6. Check top-right info table for current deviation levels
🎨 VISUAL GUIDE
• Cyan Line = Daily VWAP (fair value)
• Cyan Bands = Daily deviation zones
• Orange Line = Weekly VWAP (if enabled)
• Purple Line = Monthly VWAP (if enabled)
• Green Triangle = Long signal (oversold)
• Red Triangle = Short signal (overbought)
⚠️ IMPORTANT
Educational purposes only. Always use proper risk management. Signals are based on statistical deviation, not guarantees. Volume confirmation improves quality but doesn't guarantee outcomes. Combine with your own analysis.
The unique combination of VWAP deviation analysis, volume profile confirmation, pivot identification, and multi-timeframe confluence in a single clean interface makes Tactical Deviation different from basic VWAP indicators.
Happy Trading! 📈

VWAP ±2σ Entry Signals (volume Weighted)This indicator builds a session based VWAP and plots the upper and lower 2nd standard deviation bands around it. These bands act as dynamic volatility edges for the session. When price reaches these outer bands, it often represents an extreme stretch away from fair value a place where mean reversion or exhaustion can occur.
The indicator generates trade signals only when price approaches the band from the correct direction, which filters out a lot of noise and reduces false touches.
How It Works
VWAP is calculated from the start of each session.
Standard deviation is computed using volume weighted prices, so the bands expand and contract with real market activity.
The upper and lower 2σ bands form natural "overextended" zones around VWAP.
Most VWAP band strategies fire signals every time price touches a band which produces a lot of junk signals.
This version avoids that by requiring direction based touches, meaning:
If price is already above the band, no sell signal appears.
If price is already below the band, no buy signal appears.

Multi Rolling VWAPMulti Rolling VWAP Indicator
Displays 4 volume-weighted average price (VWAP) levels on your chart:
7D VWAP - Weekly rolling average
30D VWAP - Monthly rolling average
90D VWAP - Quarterly rolling average
365D VWAP - Yearly rolling average
Each VWAP shows where the average price is, weighted by volume. Institutional traders often use these levels as support/resistance.
Optional Features:
Bands show volatility zones (Value Area High/Low)
Anchor modes: Reset weekly, monthly, quarterly, or yearly instead of rolling
Crypto volume aggregation from 15+ exchanges for accurate calculations
Clean, minimal design for white background charts.

VWAP Wave System ToolkitGENERAL OVERVIEW:
The VWAP Wave System Toolkit is an all-in-one trading indicator based on rules from Auction Market Theory. The indicator is built around Volume-Weighted Average Prices (VWAP), Initial Balance (IB) levels, session/composite volume profiles, low-volume zones, optional candle coloring, trade checklists, dashboard readings, and a watermark.
This indicator was developed by Flux Charts in collaboration with Chris Drysdale (Trader Drysdale), author of the best-selling book VWAP Wave System.
What’s the purpose of this indicator?
The VWAP Wave System Toolkit helps traders see where market value is forming, shifting, or being rejected across different timeframes. It’s built on the ideas of Auction Market Theory, which views the market as a continuous auction between buyers and sellers searching for fair value. The indicator combines VWAPs, Initial Balance levels, and volume profiles into one system that shows how price interacts with value throughout the day, week, and month. By combining short-term and higher-timeframe data, it helps traders understand when the market is balanced and when it’s starting to discover new price areas.
What’s the theory behind this indicator?
This indicator is built on Auction Market Theory, introduced by J. Peter Steidlmayer. The theory says that markets operate as continuous auctions, constantly seeking a fair price where buyers and sellers agree on value. When price stays within a narrow range and volume builds up, the market is balanced around a value area. When price moves away from that area, the market enters price discovery, searching for a new zone of balance. VWAPs represent an evolving measure of value, while Volume Profiles and Initial Balance visualize how the auction developed during each session. Low Volume Zones often show where the market moved too quickly to trade efficiently, making them potential areas of interest for future reactions. By combining these elements, the indicator provides a picture of how the market is auctioning and where value may shift next.
VWAP WAVE SYSTEM TOOLKIT FEATURES:
The VWAP Wave System Toolkit indicator includes 7 main features:
Initial Balance Levels
Multi-Timeframe VWAPs
Session Volume Profile
Composite Volume Profile
Low Volume Zones
Checklist
Watermark
Initial Balance Levels:
🔹What is the Initial Balance?
The Initial Balance (IB) is defined by the high and low prices that form within a specific time window. Typically, this time window is the first hour after the regular day trading session starts (09:30 - 10:30 AM EST).
The high and low formed during this window create the foundation for the day’s price structure. From these two points, the indicator automatically calculates several key reference levels that show how far price has extended beyond the initial range or where it may still be balanced. Understanding how these levels are derived and how to interpret them is essential to using the Initial Balance effectively.
🔹How Initial Balance Levels are calculated:
Once the IB window closes, the indicator plots a full set of reference levels derived from the IB range. These levels are:
IB High
IB Low
IB Midpoint
x2 High / x2 Low
x2 Midpoints (x1.5 High/Low)
x3 High / x3 Low
x3 Midpoints (x2.5 High/Low)
🔹IB High & IB Low
The IB High is the highest price reached during the IB session window, and the IB Low is the lowest price reached.
🔹IB Midpoint
The IB Midpoint is the average of the IB High and IB Low.
🔹x2 High & x2 Low
The x2 levels are calculated by projecting one full IB Range above and below the Initial Balance. The IB Range is the distance between the IB High and IB Low.
🔹x2 High Midpoint & x2 Low Midpoint
The x2 High Midpoint (x1.5 High) is the average of the IB High and x2 High. The x2 Low Midpoint (x1.5 Low) is the average of the IB Low and x2 Low.
🔹x3 High & x3 Low
The x3 High/Low levels are calculated by projecting two full IB Range above and below the Initial Balance.
🔹x3 High Midpoint & x3 Low Midpoint
The x3 High Midpoint (x2.5 High) is the average of the x2 High and x3 High. The x3 Low Midpoint (x2.5 Low) is the average of the x2 Low and x3 Low.
🔹Breaks & Retests:
For every Initial Balance level, the indicator automatically tracks when price retests or breaks through them.
A Break occurs when a candle closes above or below an IB level. When this happens, the indicator plots a small blue triangle.
A Retest occurs when price approaches and touches an IB Level, and then reverses in the opposite direction. When this happens, the indicator plots a small green or red triangle.
Green Triangle: Bullish Retest - Price comes down to a level, touches it, and continues up.
Red Triangle: Bearish Retest - Price comes up to a level, touches it, and continues down.
Both breaks and retests are plotted directly on the chart for every toggled IB level. Once detected, they remain fixed and are not repainted.
Other Settings:
🔹Shade IB Range
When enabled, this setting fills the area between the IB High and IB Low (IB Range). The fill helps visually separate the Initial Balance range from the rest of the session, making it easier to identify when price is trading inside or outside of the IB. The color and opacity can also be adjusted through the settings.
🔹Apply One Color
When this setting is enabled, all toggled IB levels use the same color instead of the user’s inputted colors.
🔹Levels Labels
When enabled, text labels that identify each IB level (for example, “IB High,” “x2 High,” or “x2.5 Low”) appear next to each level.
🔹Price Labels
When enabled, the indicator displays the real-time price value of each IB level directly on the chart. These labels update automatically as price changes or when the levels shift due to recalculation from a new session.
🔹Extend Levels Right
When enabled, all toggled IB Levels will be extended infinitely to the right of the chart.
🔹Align Text Right
This setting aligns all level and price labels to the right edge of the plotted line. When disabled, text labels will be aligned to the left edge of each level.
Multi-Timeframe VWAPs:
🔹Why does this indicator include VWAPs?
This indicator includes VWAPs because they show where the most trading activity has occurred within each timeframe, helping identify the market’s fair value area. According to Auction Market Theory, price moves between periods of balance and imbalance as buyers and sellers seek fair value. VWAPs represent those balance points where the majority of trading has taken place. By plotting the Intraday, Weekly, and Monthly VWAPs, the indicator shows how value shifts across different timeframes and whether the market is balanced or moving toward a new area of value.
🔹Intraday VWAP
The Intraday VWAP measures the average traded price for the current trading session and resets each day at market open. It shows where most of the session’s trading has taken place, acting as a real-time fair value line. When price trades near the Intraday VWAP, the market is considered balanced. When price moves far above or below it, the market is exploring new value areas.
🔹Candle Coloring:
The Intraday VWAP candle coloring highlights how far price is trading from the session’s average value using the first and second standard deviation bands as visual reference zones. This feature helps users see whether price is balanced around fair value or expanding into an overextended area.
When candle coloring is enabled, each candle’s color changes based on where it closes relative to the two standard deviation bands surrounding the Intraday VWAP. The first band represents one standard deviation (1.0 STD) and the second represents one and a half standard deviations (1.5 STD).
If a candle closes above the upper 1.5 standard deviation band, it is colored a brighter green, showing strong movement above fair value. Candles closing between the upper 1.0 and 1.5 standard deviation bands are a lighter green, showing moderate strength. If a candle closes below the lower 1.5 standard deviation band, it is colored a brighter red, showing strong movement below fair value. Candles closing between the lower 1.0 and 1.5 standard deviation bands are a lighter red, showing moderate weakness. Candles that close within the ±1.0 standard deviation range remain their normal color, showing that price is balanced near the session’s average.
Both the VWAP line and its bands can be customized in the Intraday VWAP settings. Users can adjust the VWAP line color, band colors, and fill transparency. The candle colors can also be modified. The band sizes (1.0 STD and 1.5 STD by default) can be changed through their input multipliers, allowing users to control the sensitivity of the zones.
Please Note: This candle coloring applies only to the Intraday VWAP
🔹Weekly VWAP
The Weekly VWAP measures the average traded price across the current trading week and resets at the start of each new week. It reflects the fair value area that has developed over multiple trading days, providing a broader view of market balance compared to the Intraday VWAP. When price stays close to the Weekly VWAP, it indicates that the week’s trading activity is balanced. When price consistently trades above or below it, the market is moving away from that balance and forming value in a new area.
Standard Deviation Bands:
The Weekly VWAP includes optional standard deviation bands. Users can toggle 1x and 1.5x STD bands. Users can also adjust the multipliers.
Customization:
All colors for the Weekly VWAP and its standard deviation bands can be changed in the indicator’s settings. Users can adjust the VWAP line color, band colors, and fill transparency.
🔹Monthly VWAP
The Monthly VWAP measures the average traded price for the current month and resets on the first trading day of each new month. It provides the broadest view of value within this indicator, showing where the majority of trading has occurred during the current month. When price remains near the Monthly VWAP, it reflects long-term balance.
Standard Deviation Bands:
The Monthly VWAP includes optional 1x and 1.5x standard deviation bands that can be enabled or disabled. In the settings, users can adjust the standard deviation multipliers.
Customization:
The Monthly VWAP line, band colors, and fill transparency can all be modified in the indicator’s settings.
🔹VWAP Dashboard
The VWAP Dashboard provides a quick real-time overview of how price is positioned relative to the Intraday, Weekly, and Monthly VWAPs. It is displayed directly on the chart and updates automatically with each new candle.
The dashboard is divided into five labeled sections:
Intraday
Weekly
Monthly
Weekly STD
Monthly STD
Intraday, Weekly, and Monthly Sections:
These three sections show whether price is currently trading Above or Below each VWAP.
If price is above a VWAP, that section displays “Bullish”
If price is below a VWAP, that section displays “Bearish”
Weekly STD and Monthly STD:
These sections display whether price is currently inside or outside the standard deviation bands of the Weekly and Monthly VWAPs.
When price is trading within the ±1.0 standard deviation zone, the dashboard output is “Balanced Market”
When price is above the upper standard deviation, price is extending up beyond the week’s or month’s fair value, and the dashboard output is “Bullish Price Discovery”
When price is below the lower standard deviation, price is extending down beyond the week’s or month’s fair value, and the dashboard output is “Bearish Price Discovery”
🔹What is a Balanced Market
A balanced market occurs when price is trading within the ±1.0 standard deviation range of a VWAP. This shows that buyers and sellers are in general agreement on value, and trading activity is taking place around the fair value area. In this state, price tends to rotate around the VWAP rather than trend strongly away from it. Balance reflects stability in the auction process, where neither side is dominant and value is being built at current prices.
🔹What is Bullish Price Discovery
Bullish Price Discovery occurs when price trades above the upper standard deviation of a VWAP. This indicates that buyers are accepting higher prices and that value may be shifting upward. In terms of Auction Market Theory, the market is moving away from balance as it searches for a new fair value area above the prior range.
🔹What is Bearish Price Discovery
Bearish Price Discovery occurs when price trades below the lower standard deviation of a VWAP. This shows that sellers are accepting lower prices and that value may be developing beneath the prior area of balance. The market is moving out of equilibrium as participants test lower prices to find new fair value.
Session Volume Profile:
🔹Why this feature is included:
The Session Volume Profile is included to show where trading activity occurred within each session. It visually represents the volume traded at each price, helping to identify where market participants considered value to be. This ties directly to Auction Market Theory, which views markets as auctions seeking balance between buyers and sellers. The profile highlights those balance areas and shows where volume thins out, helping distinguish between value areas and areas of rejection.
🔹How is the Session Volume Profile calculated and displayed:
At the start of each selected session window, the indicator creates a new volume profile and tracks every bar in that session. For each candle, it saves the high, low, open, close, volume, and time. When the HD (High Definition) setting is enabled, and your chart is between the 1-minute and 30-minute timeframes (recommended), the indicator requests lower-timeframe data and feeds the profile with 1-minute candlesticks for more detail. The running session high and low define the vertical bounds of the volume profile. That span is split into a fixed number of rows. Each row represents a price slice. For every bar and every price row, the indicator checks whether the bar’s high-low range touches that row. If it does, it adds part of the bar’s volume to that row. The allocation uses a step-to-bar-size ratio, so that narrow bars do not overload a tall row and tall bars contribute proportionally across all rows they cross. If the bar closes above its open, that row’s “up” volume bucket is incremented. If it closes below its open, the “down” bucket is incremented. After all bars are processed, the row with the highest total becomes the Point of Control (POC). Starting from that row, the indicator expands upward and downward, adding adjacent rows until the cumulative total reaches your Value Area percentage. The upper boundary is Value Area High (VAH), and the lower boundary is Value Area Low (VAL).
For rendering, each price row becomes a horizontal box drawn from the session start time to a length proportional to that row’s volume versus the session’s maximum row volume. If you choose “Up / Down” volume, the row is split into two adjoining boxes that show the up and down portions. If you choose “Total,” a single box is drawn to the total length. If you choose “Delta,” the length reflects the absolute difference between up and down. The POC is drawn as a line across the row midpoint. VAH and VAL are drawn at the exact prices of the top and bottom value rows. While a session is open the profile keeps updating as new bars form. When the session ends, the script fixes its start and end and stops changing that profile. To avoid any issues with drawing limits, the indicator only renders the two most recent session volume profiles.
Settings:
🔹Enabled
Turns the Session Volume Profile on or off. When disabled, no session profiles, lines, or volume boxes are displayed.
🔹HD
Stands for High Definition. When enabled, the indicator requests data from the 1-minute timeframe to build a smoother, more detailed volume profile. This produces finer row distribution and more accurate POC, VAH, and VAL positioning, especially on higher chart timeframes.
🔹POC Line
Toggles the visibility of the Point of Control line. The POC represents the price level with the highest traded volume in the session. It’s drawn horizontally across the chart at that price, and its color can be customized in settings.
🔹VAH
Controls the display of the Value Area High line. The VAH is the top boundary of the range that contains the specified percentage of total traded volume (default 70%). It marks where volume starts to thin out above fair value. Users can turn it on or off and customize its color.
🔹VAL
Controls the display of the Value Area Low line. The VAL is the lower boundary of the value area and marks where volume thins out below fair value. Its visibility and color can also be customized.
🔹Session
This setting allows users to define the start and end time of the trading session used to calculate the session volume profile. Only bars within this time window are included in the volume profile. When a session ends, the volume profile locks, and a new one begins automatically when the next session begins based on the user’s input.
🔹Volume
Controls how the histogram rows are displayed:
Up/Down: Splits each price row into two parts: one for bullish candles (Up volume) and one for bearish candles (Down volume). This helps visualize buying versus selling pressure at each price.
Total: Combines both Up and Down volume into a single-colored bar for each price level. Since direction isn’t separated, this view focuses purely on where trading activity was concentrated, regardless of which side was in control. A tall bar means strong participation and interest at that price.
Delta: Displays the difference between up and down volume (Up/Down) for each row, highlighting which side controlled that price area.
🔹Value Area Volume
The Value Area Volume setting defines how much of the total session volume is considered the “value area.” By default, it’s 70%, meaning the indicator finds the price range where 70% of all trading took place during that session. This area is where buyers and sellers agreed the most on price, also known as the fair value zone.
If you increase the percentage (for example, to 80%), the value area becomes wider and includes more of the session’s trading range. Lowering it (for example, to 60%) makes it narrower, focusing only on the prices with the heaviest activity.
🔹Row Size
The Row Size controls how detailed the volume profile looks. It decides how many price levels (rows) the profile is divided into. Smaller values make the profile smoother and easier to read but less precise. Larger values add more detail and show exactly where volume clustered, but they can make the profile look denser.
The maximum value is 450 rows, and the minimum value is 5 rows. Higher values (especially above 200) can make the volume profile appear more detailed but may also cause performance issues or partial rendering on TradingView charts due to the platform’s drawing object limits. For most users, values between 50–150 give a good balance between clarity and performance.
25 Rows vs. 200 Rows:
Composite Volume Profile:
The Composite Volume Profile shows how volume is distributed across a larger selected range instead of just one session. It helps traders see where the most trading activity has taken place over multiple days. This gives a picture of long-term balance areas and important price zones that have repeatedly attracted buyers and sellers.
The Composite Profile uses the same base logic and visual settings as the Session Volume Profile, including POC Line, VAH, VAL, Volume Type, Value Area Volume, Row Size, and Colors. Any customization applied to those settings also affects the Composite Profile, ensuring a consistent appearance across both features.
🔹Session Count Setting:
This setting controls how many past sessions are merged into one composite volume profile. For example, if the Session Count is set to 5, and each session represents one trading day, the profile combines data from the last 5 trading days. A “session” refers to the time window defined in the Session Volume Profile settings.
🔹How is the Composite Volume Profile used?
In Auction Market Theory, markets move through phases of balance and imbalance as traders agree on value before moving to explore new ones. The Composite Volume Profile shows where that long-term balance has formed. Large, wide areas on the profile indicate zones where multiple sessions agreed on value. Thin areas show prices that were quickly rejected, where less time and volume were traded. Combining short-term session profiles into a composite helps identify when the market is holding near established value or entering new price discovery, confirming transitions between balance and price discovery.
Low Volume Zones:
🔹What are Low Volume Zones?
Low Volume Zones (LVZs) are price areas where trading activity was minimal compared to surrounding levels. On a volume profile, they appear as thin “valleys” between two high-volume “peaks.” These valleys show where the market moved too quickly for significant two-way trade to occur. In Auction Market Theory, they represent inefficient areas, meaning the market didn’t find fair value, so price either skipped through or rejected those levels.
🔹How are Low Volume Zones found?
The indicator identifies Low Volume Zones (LVZs) directly from Session Volume Profiles (SVPs) by analyzing the shape of its volume distribution. Each SVP is built from a series of horizontal rows, where each row represents the total traded volume within a narrow price range. The longer the row, the higher the trading activity at that price.
The indicator first locates the two largest high-volume peaks on the profile. These peaks represent the strongest areas of market activity. Once these two main peaks are found, the indicator looks on both sides of each peak for the lowest-volume row in the surrounding area. Those small-volume dips define the boundaries of the Low Volume Zones.
Each high-volume peak can therefore generate two LVZs (one above and one below it), resulting in a maximum of four Low Volume Zones per volume profile. If two LVZs overlap or share the same price range, they are automatically merged into a single larger zone, which may reduce the total count to three or fewer.
🔹How are Low Volume Zones used?
Low Volume Zones (LVZs) mark areas where the market previously traded with little participation. In Auction Market Theory, these zones represent inefficient price areas where buyers and sellers failed to agree on value. When price returns to an LVZ, it may act as an area where price tends to react differently due to lower previous trading activity. If the market still sees that area as unfair, price will reject it and reverse quickly. If the market now accepts that price level, volume builds and price moves through it smoothly as the auction seeks new balance. Traders use LVZs to identify where price may react sharply or move quickly through thin areas. When price approaches a zone from above or below, it signals potential rejection or continuation.
🔹LVZ Breaks and Retests
The indicator automatically tracks how price interacts with every detected LVZ.
A Break occurs when price fully moves through the entire LVZ and closes past it. When this happens, the indicator plots a small blue triangle.
A Retest occurs when price touches an LVZ and reverses away, showing rejection. When price comes down to a level, taps it, and continues up, it’s considered a bullish retest, and a small green triangle is plotted. When price comes up to a level, taps it, and continues down, it’s considered a bearish retest, and a small red triangle is plotted.
🔹LVZ Settings
Enabled:
Toggles LVZ detection and visualization on or off.
Realtime:
Allows LVZs to form dynamically as the current session develops, updating live as volume builds or thins out. When disabled, zones only appear once the session closes.
Please note: When this setting is enabled, zones may update or shift while the current session is still forming. Because the Session Volume Profile is continuously recalculating with new data, both the volume distribution and detected zones can change until the session closes.
Row Pivot Length:
Controls how far above and below each price row the indicator looks when identifying the highest and lowest volume points that define each Low Volume Zone. Larger values make the indicator compare a wider range of rows, while smaller values keep the analysis closer to each row’s immediate area.
Last SVPs:
Defines how many recent Session Volume Profiles are used for LVZs. For example, setting it to 3 limits LVZ detection to the last three sessions only.
Retests and Breaks:
Enables or disables the display of the retest and break markers described above.
Checklist:
The Checklist is a manual on-chart dashboard that allows traders to keep track of specific market conditions before entering a trade. Each checklist item can be toggled on or off in the indicator’s settings. When enabled, a checkmark emoji appears next to that item on the dashboard. When disabled, an X emoji appears next to that item.
This feature is designed to help traders visually confirm important steps in their process, such as reviewing trend direction, VWAP alignment, or session context. The checklist can also be repositioned anywhere on the chart using the “Location” setting for better visibility and layout preference.
Watermark:
The Watermark feature displays key chart information directly in the background, including the current ticker symbol, selected timeframe, and date. The watermark’s size, color, and transparency can be adjusted in the settings.
UNIQUENESS:
The VWAP Wave System Toolkit is unique because it brings every part of Auction Market Theory to the chart. It shows how value builds and shifts by combining Initial Balance levels, multi-timeframe VWAPs, and volume profiles. The indicator automatically marks low-volume zones where the market moved too quickly, highlights breaks and retests, and tracks how price interacts with fair value across sessions, weeks, and months. Every feature works together to give a simple view of balance, imbalance, and value development as the auction unfolds.

VWAP Trend
**Overview**
The VWAP Trend indicator is a volume-weighted price analysis tool that visualizes the relationship between price and the anchored Volume Weighted Average Price (VWAP) over different timeframes. This script is designed to reveal when the market is trending above or below its volume-weighted equilibrium point, providing a clear framework for identifying directional bias, trend strength, and potential reversals.
By combining an anchored VWAP with exponential smoothing and a secondary trend EMA, the indicator helps traders distinguish between short-term price fluctuations and genuine volume-supported directional moves.
**Core Concept**
VWAP (Volume Weighted Average Price) represents the average price of an asset weighted by traded volume. It reflects where the majority of trading activity has taken place within a chosen period, serving as a critical reference level for institutions and professional traders.
This indicator extends the traditional VWAP concept by:
1. Allowing users to **anchor VWAP to different timeframes** (Daily, Weekly, or Monthly).
2. Applying **smoothing** to create a stable reference curve less prone to noise.
3. Overlaying a **trend EMA** to identify whether current price momentum aligns with or diverges from VWAP equilibrium.
The combination of these elements produces a visual representation of price’s relationship to its fair value across time, helping to identify accumulation and distribution phases.
**Calculation Methodology**
1. **Anchored VWAP Calculation:**
The script resets cumulative volume and cumulative volume–price data at the start of each new VWAP session (based on the selected anchor timeframe). It continuously accumulates the product of price and volume, dividing this by total volume to compute the current VWAP value.
2. **Smoothing Process:**
The raw VWAP line is smoothed using an Exponential Moving Average (EMA) of user-defined length, producing a cleaner, more stable trend curve that minimizes intraperiod noise.
3. **Trend Determination:**
An additional EMA is calculated on the closing price. By comparing the position of this EMA to the smoothed VWAP, the indicator determines the prevailing market bias:
* When the trend EMA is above the smoothed VWAP, the market is considered to be in an **uptrend**.
* When the trend EMA is below the smoothed VWAP, the market is classified as a **downtrend**.
**Visual Structure**
The indicator uses color dynamics and chart overlays to make interpretation intuitive:
* **Smoothed VWAP Line:** The main trend reference, colored blue during bullish conditions and orange during bearish conditions.
* **Price Fill Region:** The area between the smoothed VWAP and price is filled with a translucent color matching the current trend, visually representing whether price is trading above or below equilibrium.
* **Trend EMA (implicit):** Although not separately plotted, it drives the color state of the VWAP, ensuring seamless visual transitions between bullish and bearish conditions.
**Inputs and Parameters**
* **VWAP Timeframe:** Choose between Daily, Weekly, or Monthly anchoring. This determines the reset frequency for cumulative volume and price data.
* **VWAP Smoothing Length:** Defines how many periods are used to smooth the VWAP line. Shorter values produce a more reactive line; longer values create smoother, steadier signals.
* **Trend EMA Length:** Sets the period for the trend detection EMA applied to price. Adjust this to calibrate how quickly the indicator reacts to directional changes.
**Interpretation and Use Cases**
* **Trend Confirmation:** When price and the trend EMA both remain above the smoothed VWAP, the market is showing strong bullish control. Conversely, consistent price action below the VWAP suggests sustained bearish sentiment.
* **Fair Value Assessment:** VWAP serves as a dynamic equilibrium level. Price repeatedly reverting to this line indicates consolidation or fair value zones, while strong directional moves away from VWAP highlight momentum phases.
* **Institutional Benchmarking:** Because large market participants often benchmark entries and exits relative to VWAP, this indicator helps align retail analysis with institutional logic.
* **Reversal Detection:** Sudden crossovers of the trend EMA relative to the VWAP can signal potential reversals or shifts in momentum strength.
**Trading Applications**
* **Trend Following:** Use VWAP’s direction and color state to determine trade bias. Long entries are favored when the VWAP turns blue, while short entries align with orange phases.
* **Mean Reversion:** In ranging conditions, traders may look for price deviations far above or below VWAP as potential reversion opportunities.
* **Multi-Timeframe Confluence:** Combine the Daily VWAP Trend with higher anchor periods (e.g., Weekly or Monthly) to confirm larger trend structure.
* **Support and Resistance Mapping:** VWAP often acts as a strong intraday or session-level support/resistance zone. The smoothed version refines this behavior into a cleaner, more reliable reference.
**Originality and Innovation**
The VWAP Trend indicator stands apart from conventional VWAP scripts through several original features:
1. **Anchor Flexibility:** Most VWAP indicators fix the anchor to a specific session (like daily). This version allows switching between Daily, Weekly, and Monthly anchors dynamically, adapting to various trading styles and time horizons.
2. **Volume-Weighted Smoothing:** The use of an EMA smoothing layer over the raw VWAP provides enhanced stability without compromising responsiveness, delivering a more analytically consistent signal.
3. **EMA-Based Trend Comparison:** By introducing a second trend EMA, the indicator creates a comparative framework that merges volume-weighted price analysis with classical momentum tracking — a rare and powerful combination.
4. **Adaptive Visual System:** The color-shifting and shaded fill between VWAP and price are integrated into a single, lightweight structure, giving traders immediate insight into market bias without the clutter of multiple overlapping indicators.
**Advantages**
* Adaptable to any market, timeframe, or trading style.
* Provides both equilibrium (VWAP) and momentum (EMA) perspectives.
* Smooths out noise while retaining the integrity of volume-based price dynamics.
* Enhances situational awareness through intuitive color-coded visualization.
* Ideal for professional, swing, and intraday traders seeking context-driven market direction.
**Summary**
The VWAP Trend indicator is a modern enhancement of the classical VWAP methodology. By merging anchored volume-weighted analysis with smoothed trend detection and visual state feedback, it provides a comprehensive perspective on market equilibrium and directional strength. It is built for traders who seek more than static price references — offering an adaptive, volume-aware framework for identifying market trends, reversals, and fair-value zones with precision and clarity.

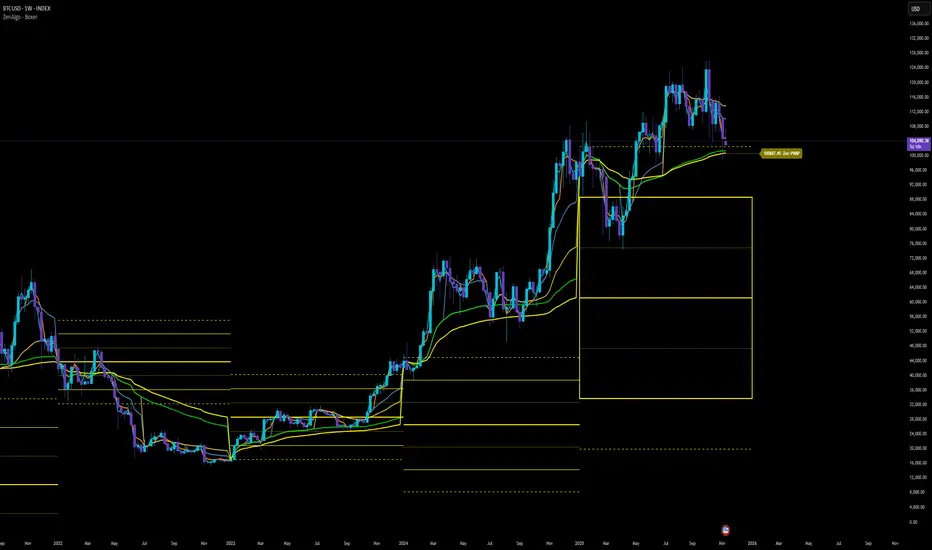
ZenAlgo - BoxerThis indicator plots multi-period Volume-Weighted Average Price (VWAP) ranges and deviation bands across several timeframes — specifically weekly, monthly, quarterly, semi-annual, and yearly. It is designed to visualize how price evolves relative to statistically weighted value areas within each period, based on both traded price and volume distribution.
Each timeframe layer is drawn independently, using its own cumulative VWAP and standard deviation calculation, and displayed as horizontal ranges aligned precisely with calendar periods. This structure allows the chart to show where price currently trades relative to past value zones and how each higher-timeframe VWAP acts as a dynamic reference for mean reversion or continuation.
Calculation Logic
1. Source and Base Inputs
The indicator uses the average of high, low, and close as its price source.
Stocks reset daily at session open.
2. VWAP and Deviation Computation
For each active timeframe, it accumulates the product of price and volume and divides it by cumulative volume, forming a continuously updated VWAP within that period.
The dispersion of price around VWAP is measured through a volume-weighted variance, converted to standard deviation.
These values form symmetrical bands around the VWAP (±1σ, ±2σ, etc.), describing the statistically typical price spread.
3. Range Drawing and Persistence
When a new period begins (e.g., a new week or month), the script finalizes the previous VWAP and deviation values, fixes them to time coordinates representing the full duration of that completed period, and draws corresponding lines or boxes across the entire range.
The user can control how many historical periods remain visible, ensuring performance and clarity even on high-frequency charts.
Each band can be toggled independently (for example ±1, ±2, ±3 deviations), and colors are adjustable per timeframe.
4. Adaptive Time Anchors
The start of each timeframe is aligned with calendar boundaries.
For stocks, the start time aligns with 9:30 New York time to coincide with market open for NYSE.
Each new anchor triggers a reset of cumulative data and creation of a new VWAP range.
5. Visualization Structure
The weekly layer is drawn first and can optionally display live VWAP bands extending backward for a user-defined number of weeks.
Monthly, quarterly, semi-annual, and yearly layers use the same computation principle but with independent accumulation windows.
The central VWAP line is dashed, while outer deviation levels are drawn as dotted or solid lines depending on their multiplier.
Boxes are rendered for key deviation intervals (e.g., ±2σ) to highlight broader value zones.
Interpretation
The VWAP represents the mean price weighted by traded volume for the given period.
Deviation bands describe statistically typical distance from that mean; outer bands mark less frequent extremes.
When price remains within ±1σ or ±2σ, it suggests balance around fair value.
Repeated touches or breaks beyond outer deviations indicate expansion or compression of volatility relative to prior periods.
Overlaps of VWAPs from multiple timeframes reveal multi-period confluence zones, useful for observing where long-term and short-term value agree or diverge.
Recommended Timeframes by Range Type
Weekly Range
Recommended timeframe: 30m to 12h
Suggested options: 30m, 1h, 2h, 3h, 4h, 6h, 8h, 12h
Using lower timeframes (like 5m) is technically possible, but higher ones provide smoother visualization and better readability.
Monthly Range
Recommended timeframe: 1h to 1D
Suggested options: 1h, 2h, 3h, 4h, 6h, 8h, 12h, 1D
Lower timeframes such as 30m may not display the full monthly range due to TradingView’s bar limits, so use higher TFs for complete coverage.
Quarterly Range
Recommended timeframe: 4h to 1W
Suggested options: 4h, 6h, 8h, 12h, 1D, 1W
Quarterly ranges benefit from higher timeframes to ensure that enough historical data is visible without exceeding chart limits.
Semi-Annual Range
Recommended timeframe: 12h to 1M
Suggested options: 12h, 1D, 1W, 1M
Lower timeframes would require too many bars to load a full six-month range; higher TFs offer a clearer overview.
Yearly Range
Recommended timeframe: 1D to 1M or higher
Suggested options: 1D, 1W, 1M
Yearly ranges often cannot display correctly on low timeframes (e.g. 1h) because of TradingView’s maximum bar limits — for instance, five years of 1h data exceeds 40,000 bars. Use higher TFs for accurate rendering.
Added Value Compared to Common Free VWAP Indicators
Incorporates five independent timeframes simultaneously (week, month, quarter, half-year, year) with exact calendar anchoring and timezone handling.
Calculates volume-weighted deviation for each layer, maintaining consistent statistical scale across assets.
Provides historical box persistence , allowing comparison of completed VWAP structures instead of only current running lines.
Enables selective visibility, bandwidth control, and precise visual differentiation through adjustable colors and line weights.
Limitations and Notes
The indicator does not generate trading signals. It is purely analytical and descriptive.
On very low timeframes or illiquid assets, deviation values may fluctuate if volume data is inconsistent.
Historical boxes are approximate in length for months with fewer than 31 days; this simplification has negligible effect on interpretation.
High visual density may occur when enabling many deviations or timeframes at once; users should limit visible history for performance.
Best Usage Practices
Apply on intraday charts (5–240 min) to study how price interacts with weekly or higher-timeframe VWAP zones.
Observe convergence of VWAPs from multiple periods to locate significant equilibrium levels.
Use outer deviations to frame potential exhaustion or re-entry zones rather than directional predictions.
Combine with independent volume- or structure-based analysis for context.
Dual Session VWAPSeparate VWAP with 1 standard deviation band for the regular session as well as electronic session

VWAP + Multi-Condition RSI Signals + FibonacciPlatform / System
Platform: TradingView
Language: Pine Script® v6
Purpose: This script is an overlay indicator for technical analysis on charts. It combines multiple tools: VWAP, RSI signals, and Fibonacci levels.
1️⃣ VWAP (Volume Weighted Average Price)
What it does:
Plots the VWAP line on the chart, which is a weighted average price based on volume.
Can be anchored to different periods: Session, Week, Month, Quarter, Year, Decade, Century, or corporate events like Earnings, Dividends, Splits.
Optionally plots bands above and below VWAP based on standard deviation or a percentage.
Supports up to 3 bands with customizable multipliers.
Will not display if the timeframe is daily or higher and the hideonDWM option is enabled.
Visual on chart: A main VWAP line with optional shaded bands.
2️⃣ RSI (Relative Strength Index) Signals
What it does:
Calculates RSI with a configurable period.
Identifies overbought and oversold zones using user-defined levels.
Generates buy/sell signals based on:
RSI crossing above oversold → Buy
RSI crossing below overbought → Sell
Detects strong signals using divergences:
Bullish divergence: Price makes lower low, RSI makes higher low → Strong Buy
Bearish divergence: Price makes higher high, RSI makes lower high → Strong Sell
Optional momentum signals when RSI crosses 50 after recent overbought/oversold conditions.
Visual on chart:
Triangles for buy/sell
Different color triangles/circles for strong and momentum signals
Background shading in RSI overbought/oversold zones
Alerts: The script can trigger alerts when any of these signals occur.
3️⃣ Fibonacci Levels
What it does:
Calculates Fibonacci retracement and extension levels based on the highest high and lowest low over a configurable lookback period.
Plots standard Fibonacci levels: 0.146, 0.236, 0.382, 0.5, 0.618, 0.786, 1.0
Plots extension levels: 1.272, 1.618, 2.0, 2.618
Helps identify potential support/resistance zones.
Visual on chart: Horizontal lines at each Fibonacci level, shaded with different transparencies.
Summary
This script is essentially a multi-tool trading indicator that combines:
VWAP with dynamic bands for trend analysis and price positioning
RSI signals with divergences for entry/exit points
Fibonacci retracement and extension levels for support/resistance
It is interactive and visual, providing both chart overlays and alert functionality for active trading strategies.
This code is provided for training and educational purposes only. It is not financial advice and should not be used for live trading without proper testing and professional guidance.

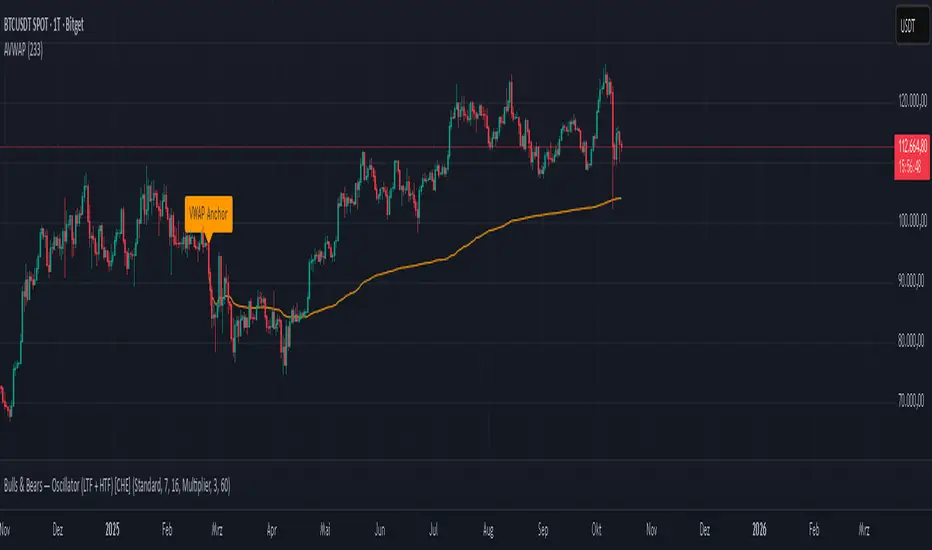
Anchored VWAP Polyline [CHE] Anchored VWAP Polyline — Anchored VWAP drawn as a polyline from a user-defined bar count with last-bar updates and optional labels
Summary
This indicator renders an anchored Volume-Weighted Average Price as a continuous polyline starting from a user-selected anchor point a specified number of bars back. It accumulates price multiplied by volume only from the anchor forward and resets cleanly when the anchor moves. Drawing is object-based (polyline and labels) and updated on the most recent bar only, which reduces flicker and avoids excessive redraws. Optional labels mark the anchor and, conditionally, a delta label when the current close is below the historical close at the anchor offset.
Motivation: Why this design?
Anchored VWAP is often used to track fair value after a specific event such as a swing, breakout, or session start. Traditional plot-based lines can repaint during live updates or incur overhead when frequently redrawn. This implementation focuses on explicit state management, last-bar rendering, and object recycling so the line stays stable while remaining responsive when the anchor changes. The design emphasizes deterministic updates and simple session gating from the anchor.
What’s different vs. standard approaches?
Baseline: Classic VWAP lines plotted from session open or full history.
Architecture differences:
Anchor defined by a fixed bar offset rather than session or day boundaries.
Object-centric drawing via `polyline` with an array of `chart.point` objects.
Last-bar update pattern with deletion and replacement of the polyline to apply all points cleanly.
Conditional labels: an anchor marker and an optional delta label only when the current close is below the historical close at the offset.
Practical effect: You get a visually continuous anchored VWAP that resets when the anchor shifts and remains clean on chart refreshes. The labels act as lightweight diagnostics without clutter.
How it works (technical)
The anchor index is computed as the latest bar index minus the user-defined bar count.
A session flag turns true from the anchor forward; prior bars are excluded.
Two persistent accumulators track the running sum of price multiplied by volume and the running sum of volume; they reset when the session flag turns from false to true.
The anchored VWAP is the running sum divided by the running volume whenever both are valid and the volume is not zero.
Points are appended to an array only when the anchored VWAP is valid. On the most recent bar, any existing polyline is deleted and replaced with a new one built from the point array.
Labels are refreshed on the most recent bar:
A yellow warning label appears when there are not enough bars to compute the reference values.
The anchor label marks the anchor bar.
The delta label appears only when the current close is below the close at the anchor offset; otherwise it is suppressed.
No higher-timeframe requests are used; repaint is limited to normal live-bar behavior.
Parameter Guide
Bars back — Sets the anchor offset in bars; default two hundred thirty-three; minimum one. Larger values extend the anchored period and increase stability but respond more slowly to regime changes.
Labels — Toggles all labels; default enabled. Disable to keep the chart clean when using multiple instances.
Reading & Interpretation
The polyline represents the anchored VWAP from the chosen anchor to the current bar. Price above the line suggests strength relative to the anchored baseline; price below suggests weakness.
The anchor label shows where the accumulation starts.
The delta label appears only when today’s close is below the historical close at the offset; it provides a quick context for negative drift relative to that reference.
A yellow message at the current bar indicates the chart does not have enough history to compute the reference comparison yet.
Practical Workflows & Combinations
Trend following: Anchor after a breakout bar or a swing confirmation. Use the anchored VWAP as dynamic support or resistance; look for clean retests and holds for continuation.
Mean reversion: Anchor at a local extreme and watch for approaches back toward the line; require structure confirmation to avoid early entries.
Session or event studies: Re-set the anchor around earnings, macro releases, or session opens by adjusting the bar offset.
Combinations: Pair with structure tools such as swing highs and lows, or with volatility measures to filter chop. The labels can be disabled when combining multiple instances to maintain chart clarity.
Behavior, Constraints & Performance
Repaint and confirmation: The line is updated on the most recent bar only; historical values do not rely on future bars. Normal live-bar movement applies until the bar closes.
No higher timeframe: There is no `security` call; repaint paths related to higher-timeframe lookahead do not apply here.
Resources: Uses one polyline object that is rebuilt on the most recent bar, plus two labels when conditions are met. `max_bars_back` is two thousand. Arrays store points from the anchor forward; extremely long anchors or very long charts increase memory usage.
Known limits: With very thin volume, the VWAP can be unavailable for some bars. Very large anchors reduce responsiveness. Labels use ATR for vertical placement; extreme gaps can place them close to extremes.
Sensible Defaults & Quick Tuning
Starting point: Bars back two hundred thirty-three with Labels enabled works well on many assets and timeframes.
Too noisy around the line: Increase Bars back to extend the accumulation window.
Too sluggish after regime changes: Decrease Bars back to focus on a shorter anchored period.
Chart clutter with multiple instances: Disable Labels while keeping the polyline visible.
What this indicator is—and isn’t
This is a visualization of an anchored VWAP with optional diagnostics. It is not a full trading system and does not include entries, exits, or position management. Use it alongside clear market structure, risk controls, and a plan for trade management. It does not predict future prices.
Inputs with defaults
Bars back: two hundred thirty-three bars, minimum one.
Labels: enabled or disabled toggle, default enabled.
Pine version: v6
Overlay: true
Primary outputs: one polyline, optional labels (anchor, conditional delta, and a warning when insufficient bars).
Metrics and functions: volume, ATR for label offset, object drawing via polyline and chart points, last-bar update pattern.
Special techniques: session gating from the anchor, persistent state, object recycling, explicit guards against unavailable values and zero volume.
Compatibility and assets: Designed for standard candlestick or bar charts across liquid assets and common timeframes.
Diagnostics: Yellow warning label when history is insufficient.
Disclaimer
The content provided, including all code and materials, is strictly for educational and informational purposes only. It is not intended as, and should not be interpreted as, financial advice, a recommendation to buy or sell any financial instrument, or an offer of any financial product or service. All strategies, tools, and examples discussed are provided for illustrative purposes to demonstrate coding techniques and the functionality of Pine Script within a trading context.
Any results from strategies or tools provided are hypothetical, and past performance is not indicative of future results. Trading and investing involve high risk, including the potential loss of principal, and may not be suitable for all individuals. Before making any trading decisions, please consult with a qualified financial professional to understand the risks involved.
By using this script, you acknowledge and agree that any trading decisions are made solely at your discretion and risk.
Do not use this indicator on Heikin-Ashi, Renko, Kagi, Point-and-Figure, or Range charts, as these chart types can produce unrealistic results for signal markers and alerts.
Best regards and happy trading
Chervolino
CloudfareCloudfare - Advanced Market Sentiment Visualization System
What It Does:
Cloudfare is a proprietary market sentiment analysis tool that visualizes real-time money flow and order flow through a dynamic cloud system. Unlike traditional indicators that lag price action, Cloudfare provides forward-looking market sentiment analysis by combining multiple proprietary algorithms.
Core Innovation - Dynamic Cloud Technology:
The cloud system is the primary innovation, not a simple mashup of existing indicators. It uses a proprietary algorithm that:
Analyzes money flow velocity through volume-weighted price action
Calculates institutional order flow patterns using proprietary OBV modifications
Implements a unique "breathing" algorithm that expands/contracts based on market volatility
Uses color-coded transparency to indicate sentiment strength (0-100 scale)
Proprietary Signal Generation:
Higher High/Lower Low Pattern Recognition: Custom algorithm that identifies price breakouts with 3-bar confirmation and volume divergence analysis
Signal Strength Scoring: Proprietary 0-100 scoring system that combines price action, volume surge detection, RSI momentum shifts, and money flow velocity
Dynamic Glow System: Signal brightness adapts to market conditions - brighter signals indicate higher probability setups
Technical Methodology:
Money Flow Analysis: Custom MFI implementation with volume weighting and momentum calculations
Order Flow Tracking: Proprietary OBV modifications that detect institutional accumulation/distribution
Volume Divergence Detection: Unique algorithm that identifies volume patterns not visible in standard indicators
Multi-Factor Confirmation: Combines 5 different confirmation methods to filter false signals
Why This Justifies Closed-Source Protection:
The core algorithms for cloud generation, signal strength calculation, and dynamic glow adaptation are proprietary mathematical models developed over 3 months of testing. These are not simple combinations of existing indicators but original mathematical approaches to market sentiment visualization.
Unique Value Proposition:
Real-time sentiment visualization through the breathing cloud system
Forward-looking signals that anticipate trend changes before price confirmation
Adaptive transparency that changes based on market conditions
Multi-timeframe VWAP integration with proprietary anchoring methodology
How to Use:
Cloud Analysis: Green cloud indicates bullish money flow, red indicates bearish pressure
Diamond Signals: Green diamonds below price for bullish reversals, red diamonds above for bearish
Signal Strength: Brighter diamonds represent higher probability setups
Trend Confirmation: 5-day confirmation system filters noise and false signals
Best Practices:
Works optimally on daily and 4-hour timeframes
Combine with price action analysis for maximum effectiveness
Monitor cloud color changes for early trend shift warnings
Use diamond signals for entry/exit timing
Author's Instructions:
To request access to this invite-only script, please contact me directly through TradingView messaging with your trading experience and intended use case. Access is granted on a case-by-case basis to ensure proper usage and support.

Multi-Exchange VWAP Aggregator (Crypto)Description:
This advanced VWAP indicator aggregates volume data from up to 9 cryptocurrency exchanges simultaneously, providing a more accurate volume-weighted average price than single-exchange VWAP calculations.
Key Features:
Multi-Exchange Aggregation - Combines volume from Binance, Coinbase, Bybit, Bitfinex, Bitstamp, Deribit, OKEx, Phemex, and FTX
Flexible Currency Pairs - Supports both spot (USD, USDT, EUR, USDC, BUSD, DAI) and perpetual futures contracts
Standard Deviation Bands - Includes customizable 1σ, 2σ, and 3σ bands for identifying overbought/oversold levels
Multiple Reset Periods - Daily, Weekly, Monthly, or Session-based VWAP calculations
Volume Calculation Options - Choose between SUM, AVG, MEDIAN, or VARIANCE for volume aggregation
Why Use This?
Traditional VWAP indicators only use volume from a single exchange, which can be misleading in fragmented crypto markets. This indicator provides a comprehensive market-wide VWAP by aggregating volume across major exchanges, giving you a more reliable benchmark for entries, exits, and institutional price levels.
Perfect for traders who want to see where the real volume-weighted price sits across the entire crypto market, not just one exchange.

Institutional Session VWAP Bands (Zeiierman)█ Overview
Institutional Session VWAP Bands (Zeiierman) plots a clean, session-aware VWAP that restarts at the “True Close” (end of the first trading hour) for each session you enable (Sydney, Tokyo, London, New York). From that anchor, the script computes a classic volume-weighted average price plus optional standard-deviation bands to frame session fair value and dispersion.
By aligning VWAP to when institutional flows settle (the first hour), you get a reference that matches real execution behavior, yielding more credible pullbacks, retests, and mean-reversion reads inside each session.
█ How It Works
⚪ Session Detection
You choose the sessions (on/off), their UTC-aligned time windows, and colors. The script detects when each session is active on your chart timeframe.
⚪ True-Close Anchoring
At session open the indicator waits. When the first hour completes, it flips the anchor on and starts a fresh VWAP for that session, mirroring how many desks treat the first hour as the real close for the prior day’s positioning.
⚪ VWAP Core
From the true-close anchor, VWAP is calculated in the standard way: cumulative (price × volume) / cumulative volume using your chosen price source (default hlc3).
⚪ VWAP Bands (σ)
Upper/Lower bands are built using a running standard deviation of the price source since the anchor. You control the σ multiplier and line width, and you can optionally fill between the bands.
█ Why Sessions + True-Close Anchoring
⚪ Institutional Timing Matters
A new anchor at the first-hour close reflects where real flows have settled, giving you a session fair-value line that aligns with how many funds evaluate prices intraday.
⚪ Cleaner Session Reads
Because VWAP and σ-bands restart each session, your retests, squeezes, and mean-reversion signals are based on today’s order-flow context, not yesterday’s inertia.
Result: a session-true fair-value with dispersion bands that stay close to the action, improving the quality of pullback entries and risk framing.
█ How to Use
⚪ Session Fair-Value Guide
Treat VWAP as the magnet for intraday value. Impulsive moves away from VWAP that fold back often present retest opportunities.
⚪ σ-Band Reversion & Breaks
Reversion: Tests beyond the upper/lower band that snap back inside can flag exhaustion.
Trend: Price riding the VWAP band in a strong trend
⚪ Session Handoffs
When one session hands to the next, watch how price behaves around the new session’s VWAP Bands after its anchor triggers. Continuation through the new VWAP vs. rejection often sets the tone.
█ Settings
UTC: Choose the timezone used to evaluate session windows (e.g., UTC+2).
Sessions (Sydney, Tokyo, London, New York): Toggle visibility and define each HHMM-HHMM window.
VWAP Price: Source for weighting.
Band Multiplier (σ): Standard deviation multiplier.
█ Related publications
True Close – Institutional Trading Sessions (Zeiierman)
-----------------
Disclaimer
The content provided in my scripts, indicators, ideas, algorithms, and systems is for educational and informational purposes only. It does not constitute financial advice, investment recommendations, or a solicitation to buy or sell any financial instruments. I will not accept liability for any loss or damage, including without limitation any loss of profit, which may arise directly or indirectly from the use of or reliance on such information.
All investments involve risk, and the past performance of a security, industry, sector, market, financial product, trading strategy, backtest, or individual's trading does not guarantee future results or returns. Investors are fully responsible for any investment decisions they make. Such decisions should be based solely on an evaluation of their financial circumstances, investment objectives, risk tolerance, and liquidity needs.

Volume Spikes + Daily VWAP SD BandsVolume Spikes + Daily VWAP SD Bands
This indicator combines volume spike detection to help traders identify potential absorption zones with daily VWAP and standard deviation bands , key price levels, continuation opportunities, and possible institutional bias.
Features:
Volume Spike Detection
Highlights candles with unusually high volume relative to a configurable SMA.
Optional filters:
Local highs/lows only (Only Use Valid Highs & Lows)
Candle shapes: Hammer / Shooter only
Candle color match: bullish spikes on green, bearish on red
Plots small circles above/below bars for bullish and bearish volume spikes.
Alerts available for both bullish and bearish spikes.
Interpretation: Volume spikes at local highs/lows can indicate absorption, where one side absorbs aggressive buying/selling pressure.
Daily VWAP
Calculates volume-weighted average price (VWAP) for the current day.
Optionally shows previous day’s VWAP for reference.
Plot lines are customizable with optional circles on lines for visual clarity.
Labels on the last bar show exact VWAP values.
Institutional Bias Insight: Price above both current and previous VWAPs may indicate bullish positioning; price below both VWAPs may indicate bearish positioning. Many professional traders consider this a clue to institutional bias, but it’s not guaranteed. Always confirm with volume, delta, or orderflow analysis.
Standard Deviation Bands
Optional x1 and x2 SD bands around the daily VWAP.
Visual fill between bands shows price volatility zones.
Can be used to identify potential support/resistance or absorption zones.
Use Case: Price bounces off first SD band may indicate continuation signals, especially when volume spikes occur at those levels.
Customizable Visuals
Colors for bullish and bearish volume spikes
VWAP and SD band colors and thickness
Optional circles and filled bands for better readability
Alerts
Bullish / Bearish Volume Spikes
Supports TradingView alert system for automated notifications
Advanced Use Cases:
Combine with Cumulative Delta or Orderflow tools to confirm true absorption zones.
Identify high-volume rejection candles signaling possible trend continuation.
Use VWAP positioning relative to price to assess potential institutional bias, keeping in mind it is probabilistic, not guaranteed.
Visualize intraday VWAP levels and volatility with SD bands for better trade timing.
Settings: Fully customizable, including volume multiplier, SMA length, session filter, candle shape, color options, and VWAP/SD display preferences.

Pivot Matrix & Multi-Timeframe Support-Resistance Analytics________________________________________
📘 Study Material for Pivot Matrix & Multi Timeframe Support-Resistance Analytics
(By aiTrendview — Educational Use Only)
________________________________________
🎯 Introduction
The Pivot Matrix & Multi Timeframe Support-Resistance Analytics indicator is designed to help traders visualize pivot points, support/resistance levels, VWAP, and volume flow analytics all in one place. Rather than giving explicit buy/sell calls, the dashboard provides reference insights so a learner may understand how different technical levels interact in real time.
This document explains its functionality step by step with formulas and usage guides.
________________________________________
1️⃣ Pivot System Logic
Pivot points are classic tools for mapping market support and resistance levels.
✦ How Calculated?
Using the Traditional Method:
• Pivot Point (PP):
PP=Highprev+Lowprev+Closeprev3PP = \frac{High_{prev} + Low_{prev} + Close_{prev}}{3}PP=3Highprev+Lowprev+Closeprev
• First Support/Resistance:
R1=2×PP−Lowprev,S1=2×PP−HighprevR1 = 2 \times PP - Low_{prev}, \quad S1 = 2 \times PP - High_{prev}R1=2×PP−Lowprev,S1=2×PP−Highprev
• Second Support/Resistance:
R2=PP+(Highprev−Lowprev),S2=PP−(Highprev−Lowprev)R2 = PP + (High_{prev} - Low_{prev}), \quad S2 = PP - (High_{prev} - Low_{prev})R2=PP+(Highprev−Lowprev),S2=PP−(Highprev−Lowprev)
• Third Levels:
R3=Highprev+2×(PP−Lowprev),S3=Lowprev−2×(Highprev−PP)R3 = High_{prev} + 2 \times (PP - Low_{prev}), \quad S3 = Low_{prev} - 2 \times (High_{prev} - PP)R3=Highprev+2×(PP−Lowprev),S3=Lowprev−2×(Highprev−PP)
• Similarly, R4/R5 and S4/S5 are extrapolated from extended range multipliers.
✦ How Used?
• Price above PP → bullish control bias.
• Price below PP → bearish control bias.
• R1–R5 levels act as resistances; S1–S5 act as supports.
Learners should watch how candles behave when approaching R/S zones to spot breakout vs. rejection conditions.
________________________________________
2️⃣ Multi Timeframe Logic
The indicator allows using daily-based pivot values (via request.security). This ensures alignment with institutional daily levels, not just intraday recalculations.
✦ Teaching Value
Understanding MTF pivots shows how markets respect higher timeframe levels (daily > intraday, weekly > daily). This helps learners grasp nested support-resistance structures.
________________________________________
3️⃣ VWAP (Volume Weighted Average Price)
Formula:
VWAPt=∑(Pricei×Volumei)∑(Volumei),Pricei=High+Low+Close3VWAP_t = \frac{\sum (Price_i \times Volume_i)}{\sum (Volume_i)}, \quad Price_i = \frac{High + Low + Close}{3}VWAPt=∑(Volumei)∑(Pricei×Volumei),Pricei=3High+Low+Close
Usage:
• VWAP is used as an institutional benchmark of fair value.
• Above VWAP = bullish flow.
• Below VWAP = bearish flow.
Learners should check whether price respects VWAP as a magnet or uses it as support/resistance.
________________________________________
4️⃣ Volume Flow Analysis
The script classifies buy volume, sell volume, and neutral volume.
• Buy Volume = if close > open.
• Sell Volume = if close < open.
• Neutral Volume = if close = open.
For daily tracking:
Buy%=DayBuyVolDayTotalVol×100,Sell%=DaySellVolDayTotalVol×100Buy\% = \frac{DayBuyVol}{DayTotalVol} \times 100, \quad Sell\% = \frac{DaySellVol}{DayTotalVol} \times 100Buy%=DayTotalVolDayBuyVol×100,Sell%=DayTotalVolDaySellVol×100
Usage for Learners:
• Dominant Buy% → accumulation/ bullish pressure.
• Dominant Sell% → distribution/ bearish pressure.
• Balanced → sideways liquidity building.
This teaches observation of order flow bias rather than relying only on price.
________________________________________
5️⃣ Dashboard Progress Bars & Colors
The script uses visual progress bars and dynamic colors for clarity. For example:
• VWAP Backgrounds: Green shades when price strongly above VWAP, Red when below.
• Volume Bars: More green blocks mean buying dominance, red means selling pressure.
This visual design turns concepts into easy-to-digest cues, useful for training.
________________________________________
6️⃣ Market Status Summary
Finally, the dashboard synthesizes all data points:
• Price vs Pivot (above or below).
• Price vs VWAP (above or below).
• Volume Pressure (buy side vs sell side).
Status Rule:
• If all three align bullish → Status box turns green.
• If mixed → Neutral grey.
• If bearish dominance → weaker tone.
Why Important?
This teaches learners that market conditions should align in confluence across indicators before confidence arises.
________________________________________
⚠️ Strict Disclaimer (aiTrendview)
The Pivot Matrix & Multi Timeframe Support-Resistance Analytics tool is developed by aiTrendview for strictly educational and research purposes.
❌ It does NOT provide buy/sell recommendations.
❌ It does NOT guarantee profits.
❌ Unauthorized use, copying, or redistribution of this code is prohibited.
⚠️ Trading Risk Warning:
• Trading involves high risk of financial loss.
• You may lose more than your capital.
• Past levels and indicators do not predict future outcomes.
This tool must be viewed as a visual education aid to practice technical analysis skills, not as trading advice.
________________________________________
✅ Now you have a step by step study guide:
• Pivot calculations explained
• VWAP with logic
• Volume breakdown
• Visual analytics
• Status confluence logic
• Disclaimer for compliance
________________________________________
⚠️ Warning:
• Trading financial markets involves substantial risk.
• You can lose more money than you invest.
• Past performance of indicators does not guarantee future results.
• This script must not be copied, resold, or republished without authorization from aiTrendview.
By using this material or the code, you agree to take full responsibility for your trading decisions and acknowledge that this is not financial advice.
________________________________________
⚠️ Disclaimer and Warning (From aiTrendview)
This Dynamic Trading Dashboard is created strictly for educational and research purposes on the TradingView platform. It does not provide financial advice, buy/sell recommendations, or guaranteed returns. Any use of this tool in live trading is completely at the user’s own risk. Markets are inherently risky; losses can exceed initial investment.
The intellectual property of this script and its methodology belongs to aiTrendview. Unauthorized reproduction, modification, or redistribution of this code is strictly prohibited. By using this study material or the script, you acknowledge personal responsibility for any trading outcomes. Always consult professional financial advisors before making investment decisions.

VWAP Suite {Phanchai}VWAP Suite {Phanchai}
Compact, readable, TradingView-friendly.
What is VWAP?
The Volume Weighted Average Price (VWAP) is the average price of a period weighted by traded volume. It’s used as a fair-value reference (mean) and resets at the start of each new period.
Included VWAP Modes
Session — resets each trading day (current session).
Week / Month / Quarter / Year — current calendar periods.
Anchored Week / Month / Quarter / Year — starts at the beginning of the previous completed period.
Rolling 7D / 30D / 90D — rolling windows: today + last 6/29/89 daily sessions.
Important
This suite does not generate buy/sell signals. It provides structure and confluence; decisions remain yours.
Use Cases
Identify fair-value zones / mean-reversion areas.
Plan TP / SL around periodic VWAPs.
Define DCA levels (e.g., anchored to prior week/month).
Gauge trend bias via VWAP slope and reactions.
How to Use
Inputs → VWAP 1..5: Choose the period per slot (Session, Anchored, Rolling, etc.) and toggle Show .
Sources: Select the price source for all VWAPs (default: HLC3).
Global: Line offset (bars) shifts plots visually (does not affect calculations).
Style tab: Adjust per-line colors, thickness, and line style.
Alerts
Price crosses a VWAP (per slot).
VWAP slope turns UP or DOWN (per slot).
Tips & Notes
Volume required: Poor/absent volume (e.g., some FX tickers) can degrade accuracy.
Anchored modes: Start at the prior period’s open; values appear only after that timestamp.
Rolling modes: Use completed daily sessions (including today).
Clutter control: If labels crowd, increase Line offset or hide unneeded slots.
Confluence: Combine with market structure, liquidity zones, or momentum filters for stronger context.
Built for clear VWAP workflows. Trade safe!

VWAP RIBBONVWAP Ribbon Indicator
The VWAP Ribbon Indicator is a comprehensive technical analysis tool designed for TradingView, utilizing multiple Volume-Weighted Average Price (VWAP) calculations across different timeframes (Daily, Weekly, Monthly, Yearly, and Custom) to identify potential trading opportunities. It generates buy/sell signals, detects institutional bias, compression zones, breakouts, false breakouts, and reversions, providing traders with a robust framework for decision-making. The indicator is highly customizable, allowing users to tailor its settings to their trading style and timeframe.
Features
Multi-Timeframe VWAPs: Plots VWAPs for Daily, Weekly, Monthly, Yearly, and a user-defined Custom timeframe, each with configurable deviation bands.
Buy/Sell Signals: Generates signals based on price interactions with VWAPs, rebounds, and crosses, with adjustable sensitivity and minimum conditions.
Institutional Bias: Identifies bullish or bearish institutional bias based on VWAP alignments and slopes.
Compression Zones: Detects areas where VWAPs converge, indicating potential accumulation or distribution phases.
Breakout and False Breakout Detection: Identifies confirmed breakouts and false breakouts after compression zones, with volume and price confirmation.
Reversion Signals: Detects reversions after price excesses beyond VWAP deviation bands, anchored to pivot points.
Custom VWAP: Allows users to define a custom VWAP timeframe (e.g., specific hours, days, weeks) for tailored analysis.
Tactical Panel: Displays real-time signal and market data in a customizable panel (compact or detailed).
Advanced Filters: Incorporates volume, RSI, EMA, and candlestick patterns to enhance signal accuracy.
How to Use
Adding the Indicator:
In TradingView, go to the Pine Editor, paste the provided code, and click "Add to Chart."
The indicator will overlay VWAP lines and deviation bands on your chart, with optional labels and a tactical panel.
Configuration: The indicator is divided into several input groups for easy customization:
⚙️ Activate VWAPs in Signals: Enable or disable Daily, Weekly, Monthly, Yearly, or Custom VWAPs for signal generation.
Visual VWAP Ribbon Settings: Toggle visibility and adjust colors for VWAP lines and deviation bands. Customize the Custom VWAP timeframe (e.g., 4 hours, 2 days).
Buy/Sell Signals: Enable labels for basic signals ("B" for Buy, "S" for Sell), set minimum conditions (1–10), and adjust signal sensitivity (0.1–1.0).
Institutional Bias Conditions: Enable background coloring for bias, set minimum VWAP spacing (%), and optionally require price alignment with VWAPs.
Statistical Signals: Enable reversion labels, adjust lookback periods, and set volume gates for reversions.
VWAP Compression: Enable detection of VWAP convergence zones and breakout/false breakout signals.
Custom Signals: Enable labels for Custom VWAP rebounds with configurable cooldowns.
Pro Filters: Apply advanced filters like minimum VWAP slope, relative price confirmation, volume thresholds, RSI, and EMA weights.
Signal Weight Configuration: Assign weights to various conditions (e.g., price crosses, rebounds) to fine-tune signal scoring.
Tactical Panel: Enable the panel, choose its position (e.g., top-right), and select compact or detailed mode.
Interpreting Signals:
Buy/Sell Signals: Appear as "B" (Buy) or "S" (Sell) labels with detailed tooltips listing triggered conditions (e.g., price crossing Daily VWAP, rebound from lower band). Signals require a minimum number of conditions (default: 3) and a normalized score above the sensitivity threshold (default: 0.5).
Institutional Bias: Background coloring (green for bullish, red for bearish) indicates VWAP alignment (e.g., Daily > Weekly > Monthly) and slope conditions. Neutral bias has no coloring.
Compression Zones: Gray background highlights areas where VWAPs are within a user-defined threshold (default: 0.5%), signaling potential accumulation/distribution.
Breakout Signals: Labeled as "BREAK ▲" or "BREAK ▼" after exiting a compression zone with strong candlestick confirmation and volume.
False Breakout Signals: Labeled as "FALSE ▲" or "FALSE ▼" when price crosses a Daily VWAP band but reverses back, indicating a failed breakout.
Reversion Signals: Labeled as "▲ R ▬ BUY" or "▼ R ▬ SELL" at pivot points after price excesses beyond VWAP bands, confirmed by volume (if enabled).
Custom VWAP Signals: Labeled as "C-BUY" or "C-SELL" for rebounds off the Custom VWAP’s deviation bands, with configurable volume and candlestick filters.
Tactical Panel: Displays the latest signal, price, date, bias, compression status, trend direction, VWAP distances, volume state, and technical summary (slopes, band distances).
Best Practices:
Timeframe Selection: The indicator auto-scales parameters for different timeframes (Daily+, Intraday ≥1h, Sub-hour). Adjust settings like lookbackBars or devThreshold for specific timeframes if autoScaleReversion is disabled.
Signal Sensitivity: Increase signalSensitivity (e.g., 0.7) for stricter signals or decrease (e.g., 0.3) for more frequent signals. Adjust minConditions to balance signal frequency and reliability.
Volume Filters: Enable useVolumeGate or useLiquidityFilter for high-liquidity assets to reduce false signals in low-volume conditions.
Compression and Breakouts: Use compression zones to anticipate breakouts. Enable showBreakoutLabels and showfalseBreakoutLabels to monitor confirmed and failed breakouts.
Custom VWAP: Set a specific timeframe (e.g., 4 hours) for intraday trading or longer periods (e.g., 2 weeks) for swing trading. Enable showCustomSignalLabels for tailored signals.
Reversion Trading: Use reversion signals for mean-reversion strategies, especially in range-bound markets. Adjust devThreshold and pivotLength for sensitivity.
Tactical Panel: Use the detailed panel for a quick overview of market conditions. Compact mode is ideal for minimal screen clutter.
Alerts:
Set up alerts for:
Institutional Bias (Buy/Sell)
VWAP Compression (Start/End)
Basic Buy/Sell Signals
Reversion Signals (Buy/Sell)
Breakout Signals (Bullish/Bearish)
False Breakout Signals (Bullish/Bearish)
Custom VWAP Rebound Signals (Buy/Sell)
Weekly/Monthly/Yearly VWAP Rebound Signals
In TradingView, go to the Alerts tab, select the indicator, and choose the desired condition. Customize alert messages as needed.
Notes
Performance: The indicator uses max_bars_back=5000 and max_labels_count=500 to ensure compatibility with most assets. For low-liquidity assets, consider enabling useLiquidityFilter to avoid noisy signals.
Customization: Experiment with weights in the "Signal Weight Configuration" group to prioritize specific conditions (e.g., increase wReboundD for Daily VWAP rebounds).
Limitations: Signals are based on historical data and VWAP interactions. Always combine with other analysis tools and risk management strategies.
License: This indicator is released under the Mozilla Public License 2.0.

Swing Anchored Vwap [BigBeluga]🔵 OVERVIEW
Swing Anchored Vwap tracks the market’s directional behavior by anchoring VWAPs (Volume Weighted Average Price) to dynamically detected swing highs and lows. It visually distinguishes the active swing VWAP from historical ones—offering traders a clean view of trend-aligned value zones with clearly marked inflection points.
🔵 CONCEPTS
Swing Anchored VWAPs: VWAPs are initiated from recent swing highs during downtrends and swing lows during uptrends.
Trend Detection: The indicator identifies trend shifts based on the breaking of recent highest or lowest price value.
Trend-Based Coloring:
• Green VWAPs: are drawn from swing lows in uptrends.
• Blue VWAPs: are drawn from swing highs in downtrends.
Sensitivity Control: The Length input defines how far back the script looks to determine swing points—shorter lengths make it more reactive.
🔵 FEATURES
Real-time VWAP projection from the current swing point, updated live.
Historical VWAP traces with slightly faded color to emphasize the current active one.
Swing markers automatically placed on highs/lows where VWAPs are anchored.
Label with price value at the end of each active VWAP line for clarity.
Adaptive color scheme that visually separates uptrend/downtrend zones.
🔵 HOW TO USE
Use active VWAP as a dynamic support/resistance guide during ongoing trends.
Observe breaks or rejections around these VWAPs for trend continuation or reversal clues .
Compare current price position relative to swing VWAPs to assess trend maturity and extension .
Combine with volume analysis or structure to increase conviction at swing points.
🔵 CONCLUSION
Swing Anchored Vwap merges the logic of anchored VWAPs and swing structure into a responsive visual tool. It helps traders stay aligned with the current trend while offering historical context via previous value anchors—ideal for intraday to swing-level analysis.

Hurst Criticality EngineThe Hurst Criticality Engine (HCE) is an advanced trading indicator designed to detect potential breakout (BUY) and exhaustion (SELL) conditions by combining multi‑scale Hurst exponent analysis with tactical confirmations such as VWAP, RSI, volume spikes, Fibonacci log‑periodic patterns and price channels.
It is optimized for traders seeking structured confluence in volatile or trending markets, and can be applied across different timeframes, from intraday scalping (1m–15m) to swing trading (1h–4h).
What It Does
HCE identifies potential turning points and momentum shifts by evaluating market persistence and volatility across several dimensions. It generates three main types of labels:
CRITICAL Signals: Triggered when multiple Hurst scales align and tactical validations confirm the setup. These can indicate breakout (BUY) or exhaustion (SELL) conditions.
CPC (Critical Pivot Confirmation): Appears at structural highs or lows validated by Hurst exponent alignment and VWAP context.
PIVOT Labels: Marks confirmed structural highs (▼) and lows (▲) that can be used to anticipate reversals or continuation setups.
A dynamic Tactical Panel shows real‑time information on signal strength, VWAP zones, last confirmed signals and the current alignment of the Hurst scales.
How It Works
The indicator integrates several analytical components, each designed to filter noise and add context:
Hurst Exponent Analysis:
Evaluates price persistence across up to five customizable time scales (default: 10, 20, 40, 80, 160 bars).
A signal is considered when at least a minimum number of scales (default: 3) align as bullish (>0.6) or bearish (<0.4).
Rolling VWAP with Standard Deviation Bands:
Plots a rolling VWAP and three customizable bands (±1σ, ±2σ, ±3σ).
Signals are validated if price is correctly positioned relative to VWAP (above for BUY, below for SELL) or if it breaks the outermost band, suggesting volatility extremes.
RSI and Volume Confirmation:
Uses RSI (default: 14‑period) to confirm momentum alignment (e.g., oversold for BUY, overbought for SELL).
Incorporates volume spikes (default: 1.5× average) as an additional confirmation of institutional participation.
Fibonacci Log‑Periodic Patterns:
Validates critical signals by checking whether price oscillations align with harmonic Fibonacci ratios (default: 0.618).
Channel Detection:
Runs a 50‑bar regression channel to identify structural boundaries.
Signals are reinforced when price interacts significantly with channel extremes or breaks out from them.
Dynamic Scoring System:
Every signal receives a score from 0 to 8 based on the confluence of all the above factors.
Scores ≥6 indicate strong alignment, 4–5 medium, 2–3 weak and ≤1 neutral.
Why This Combination?
Each component provides different insights: the Hurst exponent captures market persistence, VWAP defines value areas, RSI and volume confirm momentum and participation, while Fibonacci and channels provide structural references. This synergy allows HCE to filter noise and focus on conditions where multiple factors align, increasing the reliability of the setups.
How to Use It
Add the Indicator to the Chart:
Works on any instrument and timeframe (e.g., 1m, 5m, 15m for scalping; 1h, 4h for swing trading).
Configure Settings:
General Parameters: Set the minimum number of Hurst scales, cooldown between signals and spacing mode (manual or adaptive).
Tactical Validations: Enable or disable RSI, volume, Fibonacci or channel filters.
VWAP Settings: Adjust length (default: 50 bars) and deviation bands.
Hurst Scales: Enable up to five scales and customize their lengths.
Tactical Panel and Labels: Choose compact or detailed view and toggle the display of CRITICAL, CPC, PIVOT or Observation labels.
Interpret Signals:
CRITICAL (B/S): Labels appear above/below price with tooltips showing the signal score, VWAP status and momentum context.
CPC (⚡CPC↑ / ⚡CPC↓): Indicates critical pivots confirmed at structural highs or lows.
PIVOT (▲ / ▼): Marks confirmed highs/lows for additional context.
Observation Labels (⚠️): Highlight potential setups not meeting full CRITICAL criteria.
Monitor the Tactical Panel:
Displays the VWAP zone, number of aligned Hurst scales, signal score and last confirmed signals.
Recommendations
Use HCE as a confluence filter, not as a standalone entry tool.
Focus on signals with Medium (4–5) or Strong (≥6) scores.
Combine CPC and PIVOT labels with broader context for swing or reversal trades.
Apply on clean charts (without overlapping indicators) for optimal visualization.
Always use proper risk management, as no indicator can predict outcomes with certainty.
Chart Setup and Alerts
The script includes customizable alerts for CRITICAL, CPC, PIVOT and VWAP breakouts.
For clear visualization, use it on charts without clutter.
Works best on liquid markets (e.g., forex, crypto, stocks) and in volatile or trending conditions

52SIGNAL RECIPE VWAP Quantum Matrix Pro═══52SIGNAL RECIPE VWAP Quantum Matrix Pro ═══
◆ Overview
52SIGNAL RECIPE VWAP Quantum Matrix Pro is an advanced technical indicator based on Volume Weighted Average Price (VWAP), integrating volatility-adjusted bands and Fibonacci levels to provide multi-dimensional analysis of price movements.
It automatically applies optimized lookback periods for different timeframes, providing customized analysis for various trading styles, and helps traders effectively identify critical support/resistance zones through precise price level identification.
─────────────────────────────────────
◆ Key Features
• **Adaptive VWAP Bands**: Automatically adjusting upper and lower bands based on market volatility
• **Fibonacci Integration**: Fibonacci levels (23.6%, 38.2%, 50%, 61.8%, 78.6%) extended around VWAP center
• **Timeframe Optimization**: Automatic lookback period adjustment for each chart cycle
• **Pivot Point Analysis**: Core support/resistance levels based on volume-weighted highs and lows
• **Precision Labeling**: Accurate numerical display for all major price levels
• **Visual Gradation**: Intuitive visualization through color gradation for each Fibonacci level
─────────────────────────────────────
◆ Technical Foundation
■ VWAP Calculation Principles
• **Volume Weighting**: Calculation of real equilibrium price considering volume rather than simple price averaging
• **Standard Deviation Bands**: Statistical fluctuation range setting around VWAP center
• **Volatility Adjustment Mechanism**: Dynamic band width adjustment using current ATR to historical ATR ratio
• **Precise Price Range**: Identification of highest/lowest price range within specified lookback period
■ Fibonacci Band Implementation
• **VWAP-Centered Extension**: Division of distance from centerline (VWAP) to standard deviation bands by Fibonacci ratios
• **Symmetrical Upper/Lower Structure**: Application of identical Fibonacci ratios in both upward and downward directions
• **Color Gradation**: Progressive color changes for each Fibonacci level providing visual depth
─────────────────────────────────────
◆ Practical Applications
■ Price Movement Interpretation
• **Central Reference Point**:
▶ VWAP serves as intraday/period equilibrium price providing balance point of buying/selling pressure
▶ Movement above/below VWAP can be interpreted as short-term bullish/bearish signals
• **Band Reaction Patterns**:
▶ Reaching outer bands (100%) signals overbought/oversold conditions
▶ Reaction patterns between Fibonacci levels provide basis for trend strength and persistence judgment
■ Trading Strategy Utilization
• **Range-bound Trading**:
▶ Short-term trading utilizing bounce patterns between Fibonacci levels
▶ Oscillation trading between centerline (VWAP) and Fibonacci levels
• **Trend Following Strategy**:
▶ Breakout of Fibonacci levels aligned above/below VWAP signals trend strengthening
▶ Strong momentum confirmation when re-entering after outer band breakout
─────────────────────────────────────
◆ Advanced Configuration Options
■ Input Parameter Guide
• **Base Standard Deviation** (Default: 2.0)
▶ 1.0-1.5: Narrow bands, suitable for short-term trading
▶ 1.8-2.2: Balanced bands, optimal for general market conditions
▶ 2.5-3.0: Wide bands, suitable for long-term positions
• **Maximum/Minimum Standard Deviation** (Default: 3.0/1.0)
▶ Maximum: Cryptocurrency (4.0), Stocks/Forex (3.0), Low volatility (2.5)
▶ Minimum: Intraday trading (0.8), General (1.0), Long-term (1.5)
• **Volatility Measurement Period** (Default: 20)
▶ Short-term (10-14): Fast response, intraday trading
▶ Medium-term (15-25): Balanced response, swing trading
▶ Long-term (30-50): Noise filtering, long-term investment
• **Use Volatility Adjustment** (Default: On)
▶ On: Automatic band width adjustment based on current market volatility (recommended)
▶ Off: Fixed standard deviation bands usage
■ Timeframe-Specific Optimal Settings
• **Intraday Trading** (15min-1hr): Base standard deviation 1.8, volatility period 14
• **Swing Trading** (4hr-daily): Base standard deviation 2.0, volatility period 20
• **Position Trading** (daily-weekly): Base standard deviation 2.5, volatility period 30
■ Market-Specific Optimal Settings
• **Stock Market**: Base standard deviation 2.0, volatility period 20
• **Forex Market**: Base standard deviation 1.8, volatility period 25
• **Cryptocurrency Market**: Base standard deviation 2.5, volatility period 14, maximum standard deviation 4.0
─────────────────────────────────────
◆ Synergy with Other Indicators
• **Moving Averages**: VWAP and major moving average crossovers strengthen trend reversal signals
• **RSI/Stochastic**: Combination of VWAP band reactions in overbought/oversold zones improves reversal signal accuracy
• **Bollinger Bands**: VWAP Quantum Matrix and Bollinger Band convergence/divergence patterns are useful for volatility change prediction
• **Fibonacci Retracement**: Strong support/resistance formation when trend-direction Fibonacci retracement matches VWAP Fibonacci levels
• **Horizontal Support/Resistance**: Reaction probability significantly increases when past important price levels match VWAP Fibonacci levels
─────────────────────────────────────
◆ Conclusion
VWAP Quantum Matrix Pro provides deep insights into price action by integrating volatility-adjusted bands and Fibonacci theory into traditional VWAP analysis.
It dynamically responds to market environment changes through volume weighting and volatility adaptation mechanisms, and can be flexibly applied to various trading styles through timeframe-optimized lookback period settings.
Through appropriate input parameter configuration, the indicator can be optimized to match each trader's style and objectives, and through combination with other technical indicators, it strengthens confidence in trading decisions, ultimately enabling more precise and systematic market approaches.
─────────────────────────────────────
※ Disclaimer: Past performance does not guarantee future results. Always use appropriate risk management strategies.
═══52SIGNAL RECIPE VWAP Quantum Matrix Pro ═══
◆ 개요
52SIGNAL RECIPE VWAP Quantum Matrix Pro는 거래량 가중 평균 가격(VWAP)을 기반으로 하는 고급 기술적 지표로, 변동성 조정 밴드와 피보나치 레벨을 통합하여 가격 움직임을 다차원적으로 분석합니다.
타임프레임별로 최적화된 룩백 기간을 자동 적용하여 다양한 거래 스타일에 맞춤화된 분석을 제공하며, 정밀한 가격 레벨 식별을 통해 트레이더가 중요한 지지/저항 구간을 효과적으로 파악할 수 있도록 돕습니다.
─────────────────────────────────────
◆ 주요 특징
• **적응형 VWAP 밴드**: 시장 변동성에 따라 자동으로 조정되는 상하단 밴드 제공
• **피보나치 통합**: VWAP 중심으로 피보나치 레벨(23.6%, 38.2%, 50%, 61.8%, 78.6%) 확장
• **타임프레임 최적화**: 각 차트 주기에 맞춰 자동으로 룩백 기간 조정
• **피봇 포인트 분석**: 거래량 가중 고저가 기반의 핵심 지지/저항 레벨 표시
• **정밀 레이블링**: 모든 주요 가격 레벨에 정확한 수치 표시
• **시각적 그라데이션**: 피보나치 레벨별 컬러 그라데이션으로 직관적인 시각화
─────────────────────────────────────
◆ 기술적 기반
■ VWAP 계산 원리
• **거래량 가중치**: 단순 가격 평균이 아닌 거래량을 고려한 실질적 균형 가격 계산
• **표준편차 밴드**: VWAP 중심으로 통계적 변동 범위 설정
• **변동성 조정 메커니즘**: 현재 ATR과 과거 ATR 비율을 활용한 동적 밴드폭 조정
• **정밀 가격 범위**: 지정된 룩백 기간 내 최고/최저 가격 범위 식별
■ 피보나치 밴드 구현
• **VWAP 중심 확장**: 중심선(VWAP)에서 표준편차 밴드까지의 거리를 피보나치 비율로 분할
• **상하단 대칭 구조**: 상승과 하락 방향으로 동일한 피보나치 비율 적용
• **색상 그라데이션**: 피보나치 레벨별 점진적 색상 변화로 시각적 깊이감 제공
─────────────────────────────────────
◆ 실용적 응용
■ 가격 움직임 해석
• **중심 기준점**:
▶ VWAP은 일중/기간 내 균형가격으로 매수/매도 압력의 균형점 제공
▶ VWAP 위/아래 움직임은 단기 강세/약세 신호로 해석 가능
• **밴드 반응 패턴**:
▶ 외부 밴드(100%)에 도달 시 과매수/과매도 상태 시그널
▶ 피보나치 레벨 간 반응 패턴은 추세 강도와 지속성 판단 근거
■ 트레이딩 전략 활용
• **범위 내 거래**:
▶ 피보나치 레벨 간 바운스 패턴 활용한 단기 매매
▶ 중심선(VWAP)과 피보나치 레벨 간 오실레이션 거래
• **추세 추종 전략**:
▶ VWAP 위/아래 정렬된 피보나치 레벨 돌파는 추세 강화 신호
▶ 외부 밴드 돌파 후 다시 진입 시 강한 모멘텀 확인
─────────────────────────────────────
◆ 고급 설정 옵션
■ 인풋 파라미터 가이드
• **기본 표준 편차 (Base Standard Deviation)** (기본값: 2.0)
▶ 1.0-1.5: 좁은 밴드, 단기 거래에 적합
▶ 1.8-2.2: 균형 잡힌 밴드, 일반적 시장 환경에 최적
▶ 2.5-3.0: 넓은 밴드, 장기 포지션에 적합
• **최대/최소 표준 편차 (Maximum/Minimum Standard Deviation)** (기본값: 3.0/1.0)
▶ 최대: 암호화폐(4.0), 주식/외환(3.0), 저변동성(2.5)
▶ 최소: 일중 거래(0.8), 일반(1.0), 장기(1.5)
• **변동성 측정 기간 (Volatility Measurement Period)** (기본값: 20)
▶ 단기(10-14): 빠른 반응, 일중 거래
▶ 중기(15-25): 균형 잡힌 반응, 스윙 트레이딩
▶ 장기(30-50): 노이즈 필터링, 장기 투자
• **변동성 조정 사용 (Use Volatility Adjustment)** (기본값: 켜짐)
▶ 켜짐: 현재 시장 변동성에 따라 밴드 폭 자동 조정 (권장)
▶ 꺼짐: 고정된 표준편차 밴드 사용
■ 타임프레임별 최적 설정
• **일중 거래** (15분-1시간): 기본 표준편차 1.8, 변동성 기간 14
• **스윙 트레이딩** (4시간-일봉): 기본 표준편차 2.0, 변동성 기간 20
• **포지션 트레이딩** (일봉-주봉): 기본 표준편차 2.5, 변동성 기간 30
■ 시장별 최적 설정
• **주식 시장**: 기본 표준편차 2.0, 변동성 기간 20
• **외환 시장**: 기본 표준편차 1.8, 변동성 기간 25
• **암호화폐 시장**: 기본 표준편차 2.5, 변동성 기간 14, 최대 표준편차 4.0
─────────────────────────────────────
◆ 다른 지표와의 시너지
• **이동평균선**: VWAP과 주요 이동평균선 교차는 추세 전환 신호 강화
• **RSI/스토캐스틱**: 과매수/과매도 구간에서 VWAP 밴드 반응과 결합 시 반전 신호 정확도 향상
• **볼린저 밴드**: VWAP Quantum Matrix와 볼린저 밴드 수렴/발산 패턴은 변동성 변화 예측에 유용
• **피보나치 리트레이스먼트**: 추세 방향 피보나치 리트레이스먼트와 VWAP 피보나치 레벨 일치 시 강력한 지지/저항 형성
• **수평 지지/저항**: 과거 중요 가격대와 VWAP 피보나치 레벨 일치 시 반응 확률 대폭 증가
─────────────────────────────────────
◆ 결론
VWAP Quantum Matrix Pro는 전통적인 VWAP 분석에 변동성 조정 밴드와 피보나치 이론을 통합하여 가격 행동에 대한 깊이 있는 통찰력을 제공합니다.
거래량 가중치와 변동성 적응 메커니즘을 통해 시장 환경 변화에 동적으로 대응하며, 타임프레임별 최적화된 룩백 기간 설정으로 다양한 거래 스타일에 유연하게 적용할 수 있습니다.
적절한 인풋 파라미터 설정을 통해 각 트레이더의 스타일과 목표에 맞게 지표를 최적화할 수 있으며, 다른 기술적 지표들과의 조합을 통해 트레이딩 결정에 대한 확신을 강화하고, 궁극적으로 더 정밀하고 체계적인 시장 접근을 가능하게 합니다.
─────────────────────────────────────
※ 면책 조항: 과거 성과가 미래 결과를 보장하지 않습니다. 항상 적절한 리스크 관리 전략을 사용하세요.

Sniper Mini VWAPThis script plots dynamic, session-based VWAPs for key intraday timeframes:
1H (green), 4H (orange), 8H (purple), and Daily (red).
Each VWAP resets at the start of its own session, giving traders a real-time view of price relative to average volume-weighted value. These lines often act as intraday support, resistance, or liquidity magnets — great for scalping, fade setups, and sniper-style entries.
You can toggle each VWAP on or off for a cleaner chart.
This version does not use anchored VWAPs — it’s designed for traders who need fast feedback as price develops within active sessions.
