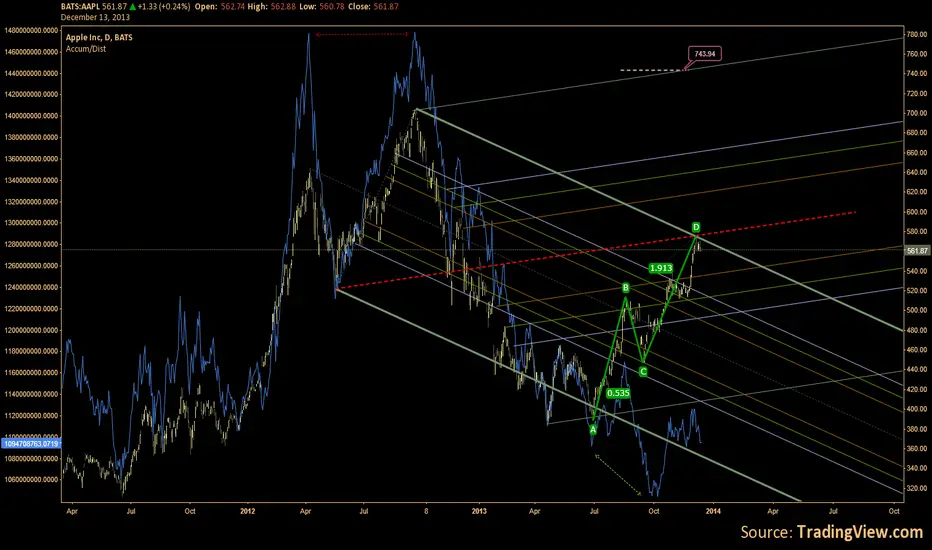
It is getting interesting this chart. The AB=CD finished the pattern and the price is hitting into a cluster of resistances. However, more noticeable is the accumulation/distribution line projected behind the price.
For few years, the A/D line followed in tandem the price confirming the trends strength- being on the upside or downside. For the last months the A/D line failed to follow the price and is moving on the opposite direction and it could be interpreted as selling pressure is beginning to increase. While there is clear a bullish divergence, the latest divergence shows weakness in uptrend.
it is best to allow a week or two for the other signals to develop.
免責事項
これらの情報および投稿は、TradingViewが提供または保証する金融、投資、取引、またはその他の種類のアドバイスや推奨を意図したものではなく、またそのようなものでもありません。詳しくは利用規約をご覧ください。
免責事項
これらの情報および投稿は、TradingViewが提供または保証する金融、投資、取引、またはその他の種類のアドバイスや推奨を意図したものではなく、またそのようなものでもありません。詳しくは利用規約をご覧ください。