AAPL has already been affected by a Bearish Head & Shoulders reversal pattern earlier this year (see related).
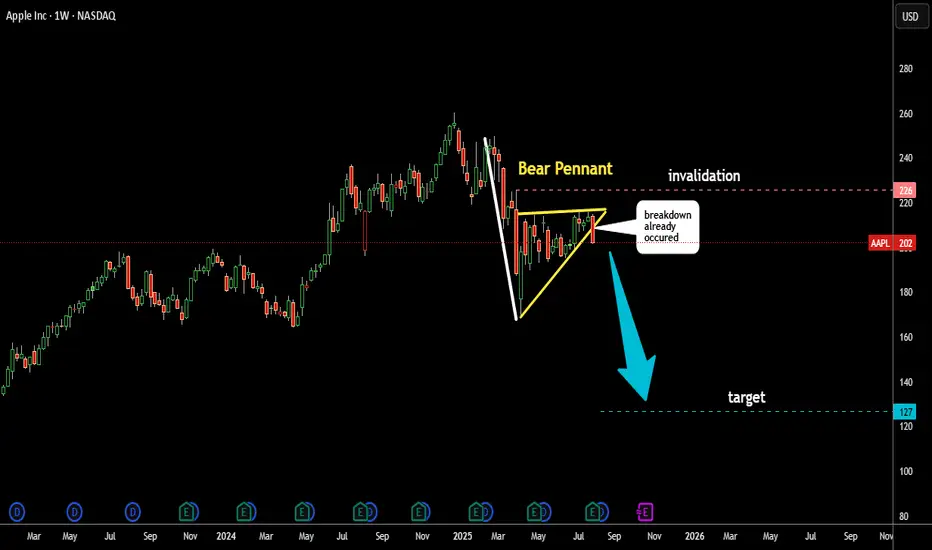
Now, another bearish pattern has formed — a Pennant (highlighted in yellow).
The price has broken below the Pennant’s support, triggering a potential bearish move.
The target is calculated by subtracting the length of the Pole (in white) from the support level of the pattern.
This target is marked with a blue dashed line at $127.
Is Apple melting down again?
I’d love to read your thoughts.
関連の投稿
免責事項
この情報および投稿は、TradingViewが提供または推奨する金融、投資、トレード、その他のアドバイスや推奨を意図するものではなく、それらを構成するものでもありません。詳細は利用規約をご覧ください。
免責事項
この情報および投稿は、TradingViewが提供または推奨する金融、投資、トレード、その他のアドバイスや推奨を意図するものではなく、それらを構成するものでもありません。詳細は利用規約をご覧ください。