Flag and pole patterns
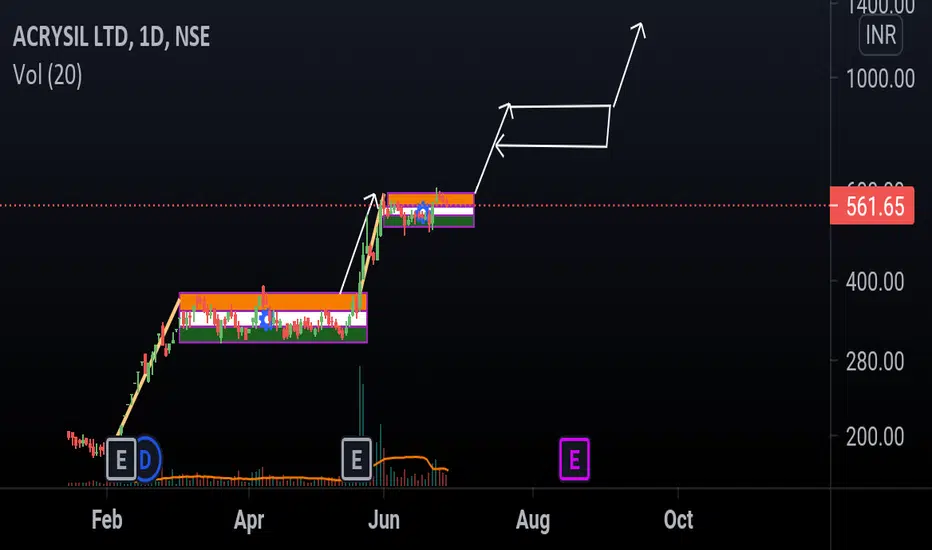
This chart is for representation purposes only. It shows how price action is formed in a very bullish market structure. A rally is followed by a consolidation phase and price don't fall to a great extent during this phase. Profits are booked and new hands are ready to grab it and again a surge is seen.
免責事項
この情報および投稿は、TradingViewが提供または推奨する金融、投資、トレード、その他のアドバイスや推奨を意図するものではなく、それらを構成するものでもありません。詳細は利用規約をご覧ください。
免責事項
この情報および投稿は、TradingViewが提供または推奨する金融、投資、トレード、その他のアドバイスや推奨を意図するものではなく、それらを構成するものでもありません。詳細は利用規約をご覧ください。