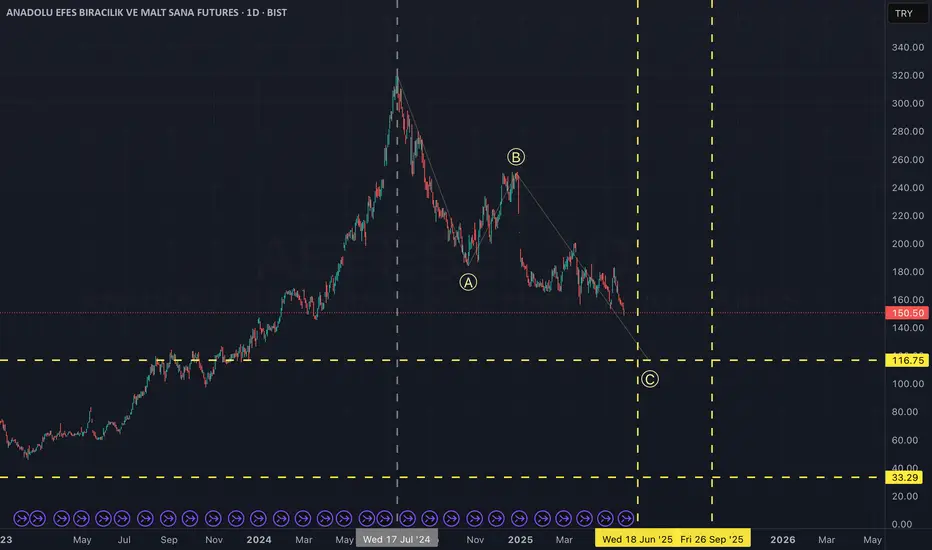
Ee observed an all-time high on July 17, 2025. Since then, the market appears to be undergoing an ABC corrective pattern. Based on the wave structure and proportions, it seems we are currently in the final leg of this correction.
Two potential target zones, both in terms of price and timing, are marked with yellow lines on the chart. In my view, there is a high probability that the correction will conclude before June 18. However, if the final leg deepens further than expected, the completion of this corrective phase could be extended into September.
Two potential target zones, both in terms of price and timing, are marked with yellow lines on the chart. In my view, there is a high probability that the correction will conclude before June 18. However, if the final leg deepens further than expected, the completion of this corrective phase could be extended into September.
トレード稼働中
Since the chart on May 29, with the latest wave starting to take shape, I'm updating the potential reversal zones as shown in the chart. While the gray areas are less probable zones, it's still worth keeping an eye on them.免責事項
これらの情報および投稿は、TradingViewが提供または保証する金融、投資、取引、またはその他の種類のアドバイスや推奨を意図したものではなく、またそのようなものでもありません。詳しくは利用規約をご覧ください。
免責事項
これらの情報および投稿は、TradingViewが提供または保証する金融、投資、取引、またはその他の種類のアドバイスや推奨を意図したものではなく、またそのようなものでもありません。詳しくは利用規約をご覧ください。