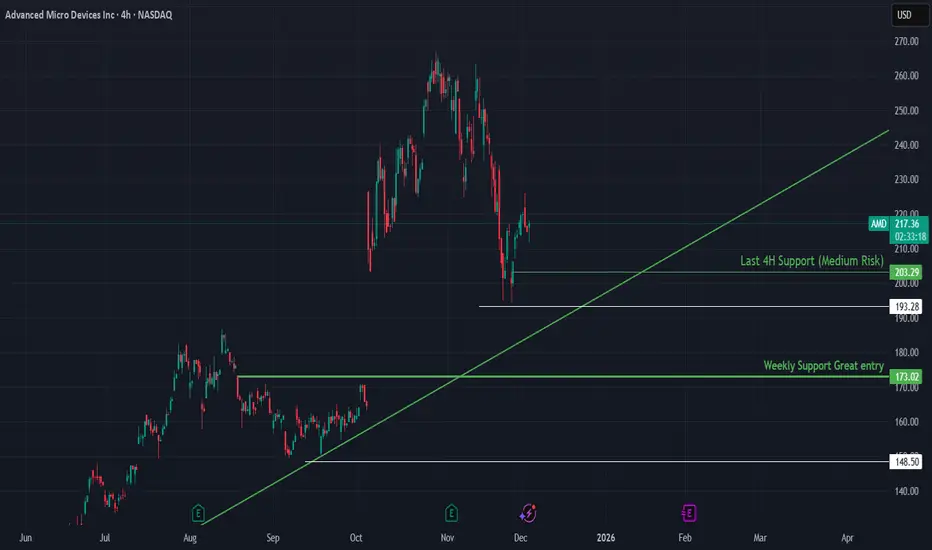
AMD is attempting to stabilize after a strong corrective move from its recent highs. Price has formed a short-term rebound, but remains below local resistance levels. The chart shows two major support structures: a 4H support at $203.29 and a deeper weekly support at $173.02, which stands out as the highest-value entry zone. As long as the broader uptrend structure holds, AMD retains a constructive bias.
🔍 Technical Analysis
Current Price: ~$217.82
Recent price action highlights:
AMD is attempting to build a base after a sharp pullback.
The last 4H support at $203.29 is the nearest active demand zone (medium-risk).
A deeper pullback would bring price into the weekly support at $173.02, which is a highly attractive long-term entry zone.
The ascending trendline from the September/October base remains intact, supporting the medium-term bullish bias.
Structure:
Short-term volatility within a broader uptrend, with two clean support zones stacked below current price.
🛡️ Support Zones (if pullback continues)
🟢 $203.29 (4H Support – Medium Risk)
▫️ Stop-loss (White Line): $193.28
Nearest active demand, suitable for shorter-term traders.
🟢 $173.02 (Weekly Support – Great Entry)
▫️ Stop-loss (White Line): $148.50
Major weekly structure, excellent swing entry if reached.
🧭 Outlook
There are several valid approaches depending on trading style:
1️⃣ Enter near the 4H support at $203.29
This is the closest support and a decent medium-risk entry for traders looking to position early.
However, it is not the strongest structural level on the chart.
2️⃣ Wait for the weekly support at $173.02
This is the best value zone and offers the highest reward relative to risk.
Ideal for swing traders seeking a cleaner setup.
Bias:
Constructive while AMD trades above $203, strongly bullish if the weekly $173 zone is reached and holds.
🌍 Fundamental Insight
AMD continues to expand its presence in high-performance computing, AI accelerators, and data center GPU markets. With increasing competition in AI chips, AMD’s MI300 lineup has gained early traction, while strong consumer CPU sales and expanding cloud partnerships support long-term fundamentals.
Short-term volatility reflects broader tech market conditions more than AMD-specific weakness.
✅ Conclusion
AMD is showing early signs of stabilization, but the strongest bullish opportunities lie at the $203 4H support and especially the $173 weekly support.
These levels offer clean risk–reward setups depending on the trader’s style, while the broader trend remains intact.
If you found this useful, don’t forget to like & follow for more structure-based insights.
免責事項
この情報および投稿は、TradingViewが提供または推奨する金融、投資、トレード、その他のアドバイスや推奨を意図するものではなく、それらを構成するものでもありません。詳細は利用規約をご覧ください。
免責事項
この情報および投稿は、TradingViewが提供または推奨する金融、投資、トレード、その他のアドバイスや推奨を意図するものではなく、それらを構成するものでもありません。詳細は利用規約をご覧ください。