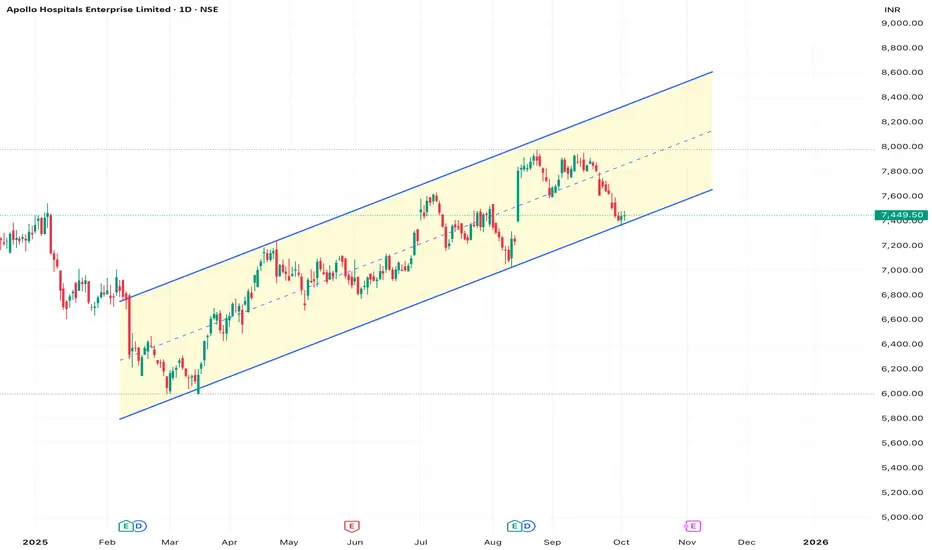
The price is currently sitting at ₹7,449.50, making it a high-interest area from a technical perspective.
Market Structure & Chart Pattern Analysis
Chart Pattern (Classic TA): The price is perfectly tracking the lower boundary (support) of a long-term Upward Channel. This is a classic "Buy the Dip" zone in a well-defined bullish trend structure.
Trend: The macro trend remains Bullish, as defined by the sustained movement within the rising channel since early 2025.
Current Location: The touch of the channel support at ₹7,400 - ₹7,450 offers a low-risk, high-reward entry point for a swing trade.
ICT Concepts for Confirmation
Discount Zone: The price is near the lowest quadrant of the recent price action (relative to the August high), placing it in a Discount Array, making it an opportune area to look for institutional buying.
Liquidity Sweep/Confirmation: The highest probability entry would involve waiting for one of the following on a lower timeframe (e.g., 4H/1H):
A slight break below the channel support (a liquidity grab/sweep of Sell-Side Liquidity - SSL below the recent swing lows) followed by an immediate reversal back into the channel.
A clear formation of a Bullish Order Block (final down candle before the expected strong move up) or an unmitigated Fair Value Gap (FVG) at the channel support line.
Market Structure Shift (MSS): Wait for a short-term MSS on a lower timeframe to confirm the buyers are taking control before entering.
Trade Plan
BUY (Anticipating Channel Bounce)
Entry Zone: ₹7,480 - ₹7,500 (Enter near the channel support, ideally with confirmation)
Stop Loss (SL): Below ₹7,300 (This places the SL clearly outside the channel and below the psychological support, invalidating the bullish channel structure).
Risk: ₹150 - ₹200 per share (The difference between current price/entry and SL).
Target 1 (T1): ₹7,900 - ₹8,000 (Channel Midline & psychological resistance).
Target 2 (T2): ₹8,200 - ₹8,400 (Channel Upper Boundary/Resistance).
Risk/Reward: Favorable (R:R is 1:2 to 1:4 depending on entry and target).
免責事項
これらの情報および投稿は、TradingViewが提供または保証する金融、投資、取引、またはその他の種類のアドバイスや推奨を意図したものではなく、またそのようなものでもありません。詳しくは利用規約をご覧ください。
免責事項
これらの情報および投稿は、TradingViewが提供または保証する金融、投資、取引、またはその他の種類のアドバイスや推奨を意図したものではなく、またそのようなものでもありません。詳しくは利用規約をご覧ください。