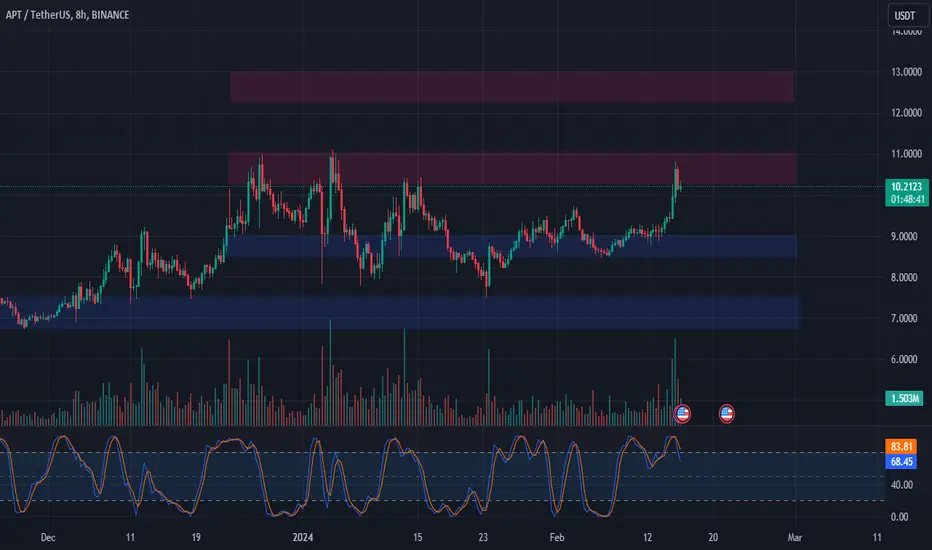
📊 Technical Overview:
APT: Testing resistance at $10.30 - $11.00.
Key Levels: $10.30, $11.00, $9.00, $12.30, $13.00.
📉📈 Trade Analysis:
Resistance Test: APT testing the resistance area.
Overbought: Overbought on the 8-hour chart.
Support Levels: Potential support at $9.00.
Long Trade Plan: Consider entering a long trade if $9.00 holds.
Profit Targets: $10.30 - $11.00, $12.30 - $13.00.
Potential Gain: Roughly a 45% gain from $9.00 to $13.00.
Stop Loss: Below $8.50.
🚀🔄 Note: Monitor price action around $9.00 and adjust trade strategy accordingly. 📊💡 #APT #TradeAnalysis #StockMarket 📈📉
免責事項
この情報および投稿は、TradingViewが提供または推奨する金融、投資、トレード、その他のアドバイスや推奨を意図するものではなく、それらを構成するものでもありません。詳細は利用規約をご覧ください。
免責事項
この情報および投稿は、TradingViewが提供または推奨する金融、投資、トレード、その他のアドバイスや推奨を意図するものではなく、それらを構成するものでもありません。詳細は利用規約をご覧ください。