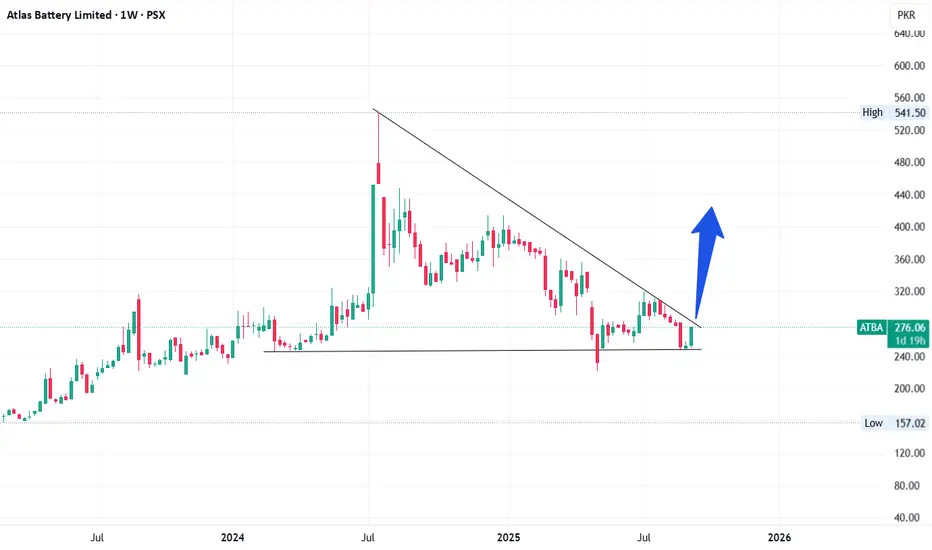
ATBA is currently taking trendline resistance as shown in chart. Once broken (weekly closing above 287), it will bounce back to its recent high (~450).
On weekly timeframe, a falling wedge pattern can be observed which is a bullish pattern.
Bad result in recent quarter may cause this trendline resistance to be a tough task to break. However, on a bigger (monthly) timeframe, a beautiful inverse head and shoulder is forming that may take its effect in coming months.
This is not a buy / sell call, be cautious while investing in fundamentally weak stocks.
Keep your stoploss at 221 (Recent low on May 7th).
免責事項
これらの情報および投稿は、TradingViewが提供または保証する金融、投資、取引、またはその他の種類のアドバイスや推奨を意図したものではなく、またそのようなものでもありません。詳しくは利用規約をご覧ください。
免責事項
これらの情報および投稿は、TradingViewが提供または保証する金融、投資、取引、またはその他の種類のアドバイスや推奨を意図したものではなく、またそのようなものでもありません。詳しくは利用規約をご覧ください。