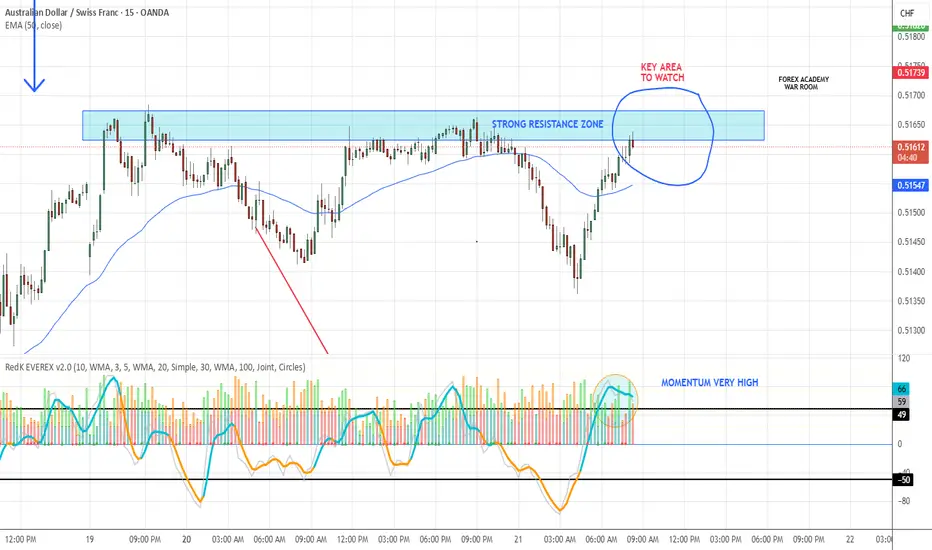
On the 15-minute timeframe, AUDCHF is pressing into a solid resistance zone. Momentum is already high, suggesting the potential for a down move.
But remember: the 15M chart can be much more volatile than higher timeframes. For a confirmed VMS setup, we still need:
✅ A clean engulfing candle to the downside
✅ Volume spike (75+) to show strong intent
Until those triggers align, this one stays on watch. Patience first — the signals will tell us when to act.
#Forex #AUDCHF #VMSStrategy #TradingView
免責事項
この情報および投稿は、TradingViewが提供または推奨する金融、投資、トレード、その他のアドバイスや推奨を意図するものではなく、それらを構成するものでもありません。詳細は利用規約をご覧ください。
免責事項
この情報および投稿は、TradingViewが提供または推奨する金融、投資、トレード、その他のアドバイスや推奨を意図するものではなく、それらを構成するものでもありません。詳細は利用規約をご覧ください。