📊 Technical Breakdown – AXISCETF (AXISAMC ETF)
🔍 Key Observations:
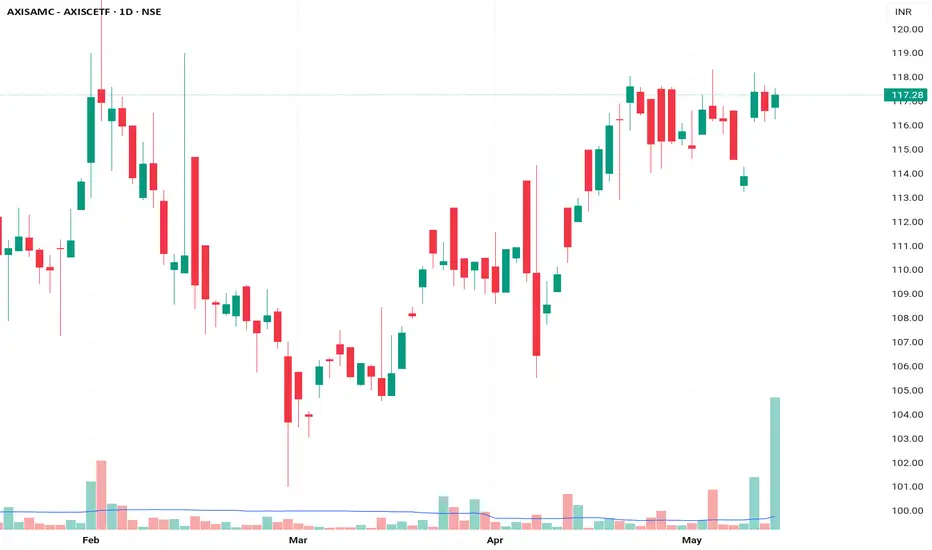
Current Price: ₹117.28
Recent Move: Mild bullish momentum near recent highs.
Volume Spike: Noticeable volume surge on the most recent candle — highest volume in months.
Candle Behavior:
Strong bullish candle 2 sessions ago.
Two small-bodied candles (spinning tops/doji-type), indicating consolidation or indecision.
Indicators on Chart:
Looks like Bollinger Bands (red curves)
Possibly Donchian Channel or support/resistance bands (green lines)
📈 Trend & Structure:
Aspect Observation
Trend Bullish short-term structure (higher highs, higher lows from early April)
Volume Heavy surge — likely accumulation or breakout attempt
Resistance Zone ₹117.50–₹118.00 (recent top range)
Support Zone ₹113.50–₹114.00 (recent breakout candle low)
✅ Stage Classification:
Stage 2 – Early Uptrend Phase
Breakout has occurred already from a sideways base (~₹108–₹114).
Holding above upper Bollinger Band middle line = strength.
Now consolidating just under resistance — likely forming a flag or base for continuation.
🔄 Trading Strategy
📌 Aggressive Entry (if volume remains high):
Buy above ₹118 (fresh breakout).
Stop-loss: ₹114.80 (below tight base).
Target Zones:
₹122–123 (short-term)
₹128+ (medium-term if ETF continues uptrend)
🕵️ Conservative Traders:
Wait for a decisive breakout with volume above ₹118.
Watch for Bollinger Band expansion and closing above resistance.
🧠 Final Summary:
Parameter Status
Trend Bullish
Volume Strong recent surge
Resistance to Watch ₹118
Stage Stage 2 (trend continuation)
Action Plan Buy on breakout with SL at ₹114.8
🔍 Key Observations:
Current Price: ₹117.28
Recent Move: Mild bullish momentum near recent highs.
Volume Spike: Noticeable volume surge on the most recent candle — highest volume in months.
Candle Behavior:
Strong bullish candle 2 sessions ago.
Two small-bodied candles (spinning tops/doji-type), indicating consolidation or indecision.
Indicators on Chart:
Looks like Bollinger Bands (red curves)
Possibly Donchian Channel or support/resistance bands (green lines)
📈 Trend & Structure:
Aspect Observation
Trend Bullish short-term structure (higher highs, higher lows from early April)
Volume Heavy surge — likely accumulation or breakout attempt
Resistance Zone ₹117.50–₹118.00 (recent top range)
Support Zone ₹113.50–₹114.00 (recent breakout candle low)
✅ Stage Classification:
Stage 2 – Early Uptrend Phase
Breakout has occurred already from a sideways base (~₹108–₹114).
Holding above upper Bollinger Band middle line = strength.
Now consolidating just under resistance — likely forming a flag or base for continuation.
🔄 Trading Strategy
📌 Aggressive Entry (if volume remains high):
Buy above ₹118 (fresh breakout).
Stop-loss: ₹114.80 (below tight base).
Target Zones:
₹122–123 (short-term)
₹128+ (medium-term if ETF continues uptrend)
🕵️ Conservative Traders:
Wait for a decisive breakout with volume above ₹118.
Watch for Bollinger Band expansion and closing above resistance.
🧠 Final Summary:
Parameter Status
Trend Bullish
Volume Strong recent surge
Resistance to Watch ₹118
Stage Stage 2 (trend continuation)
Action Plan Buy on breakout with SL at ₹114.8
関連の投稿
免責事項
これらの情報および投稿は、TradingViewが提供または保証する金融、投資、取引、またはその他の種類のアドバイスや推奨を意図したものではなく、またそのようなものでもありません。詳しくは利用規約をご覧ください。
関連の投稿
免責事項
これらの情報および投稿は、TradingViewが提供または保証する金融、投資、取引、またはその他の種類のアドバイスや推奨を意図したものではなく、またそのようなものでもありません。詳しくは利用規約をご覧ください。