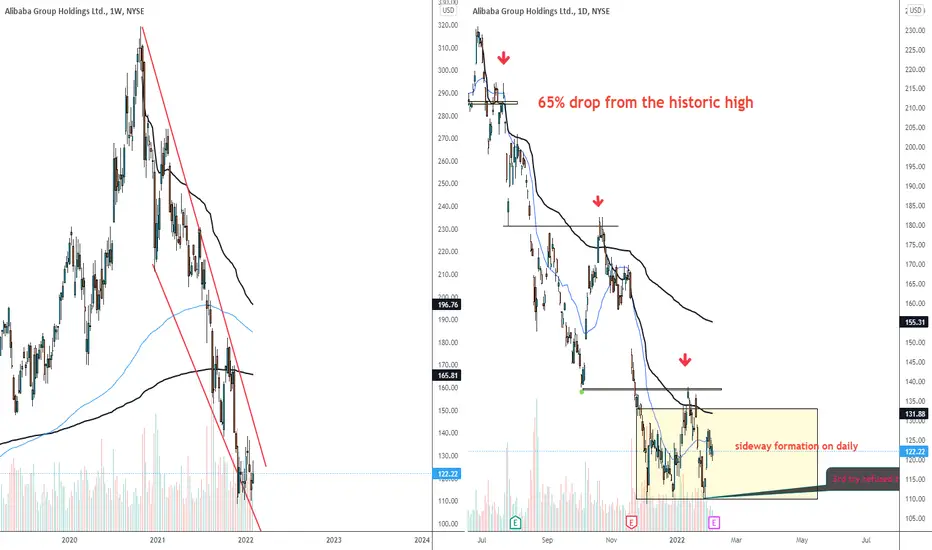
Hello everyone. It's been a bloody two-year for BABA investors as it tumbled by more than 60% from late Oct. 2020.
As I analyze the daily chart, I noticed two things: firstly, the red downtrend has been soooo well respected. secondly, major daily flip levels served as good supplies.
What got my attention is not just the sideway formation on the daily. The decreased volume as well as the 3rd try failure to create new low are odds-enhancers for the bullish buyers.
I'm still loading tech ETTs with exposure to Chinese tech giants. Admittedly, current P&L is around -10% before CNY. I'm confident to breakeven and make 20-30% in 2022.
I recommend using dollar-cost-averaging strategy. We'd be patient for this setup to be paid off.
What do you think? Give me a like if you're with me.
ノート
The chart is a bit ugly with a clear sideway structure breakout. however, I'm a bit confident about the valuation, let's wait and see. plan your trade and trade your plan
関連の投稿
免責事項
これらの情報および投稿は、TradingViewが提供または保証する金融、投資、取引、またはその他の種類のアドバイスや推奨を意図したものではなく、またそのようなものでもありません。詳しくは利用規約をご覧ください。
plan your trade and trade your plan
関連の投稿
免責事項
これらの情報および投稿は、TradingViewが提供または保証する金融、投資、取引、またはその他の種類のアドバイスや推奨を意図したものではなく、またそのようなものでもありません。詳しくは利用規約をご覧ください。