The strength in the move in credit spreads is thought provoking
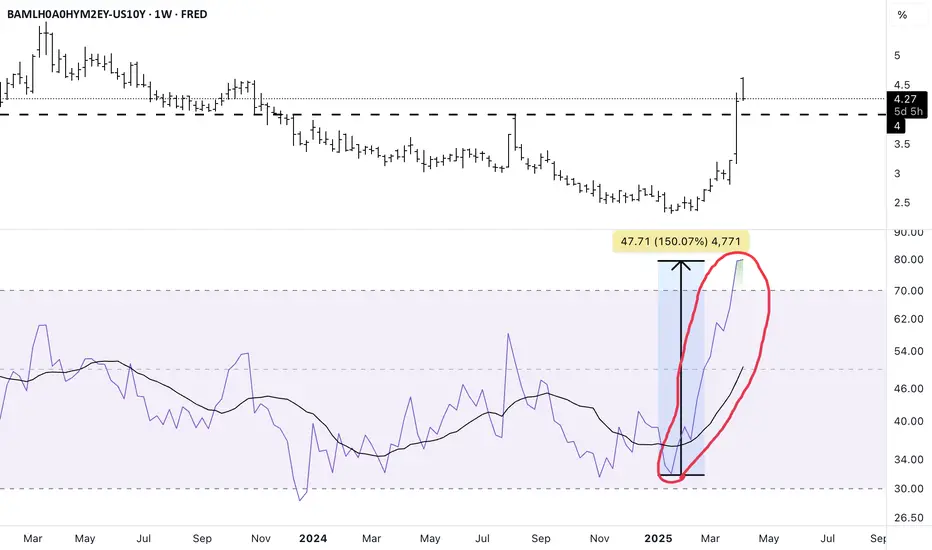
The strength of the move in credit spreads since the week of Jan 20th is really unusual. Even during Covid when spreads really widened in a short amount of time the "strength" of the move doesn't compare to what we are witnessing right now with this move.
One comparable timeframe Is June 2007-July 2007. The move in the RSI in credit spreads is what STARTED the great financial crisis. After this huge move happened spreads rose for the next 73 weeks or a little under a year and a half making higher highs and higher lows.

Another comparable timeframe is May 2002-July 2002; Spreads had already been making higher highs and higher lows; were already above 4; and then this move is what ENDED the dot.com bubble.

One comparable timeframe Is June 2007-July 2007. The move in the RSI in credit spreads is what STARTED the great financial crisis. After this huge move happened spreads rose for the next 73 weeks or a little under a year and a half making higher highs and higher lows.
Another comparable timeframe is May 2002-July 2002; Spreads had already been making higher highs and higher lows; were already above 4; and then this move is what ENDED the dot.com bubble.
免責事項
これらの情報および投稿は、TradingViewが提供または保証する金融、投資、取引、またはその他の種類のアドバイスや推奨を意図したものではなく、またそのようなものでもありません。詳しくは利用規約をご覧ください。
免責事項
これらの情報および投稿は、TradingViewが提供または保証する金融、投資、取引、またはその他の種類のアドバイスや推奨を意図したものではなく、またそのようなものでもありません。詳しくは利用規約をご覧ください。