Bank Nifty Trading Plan – 11-Nov-2024
Intro:
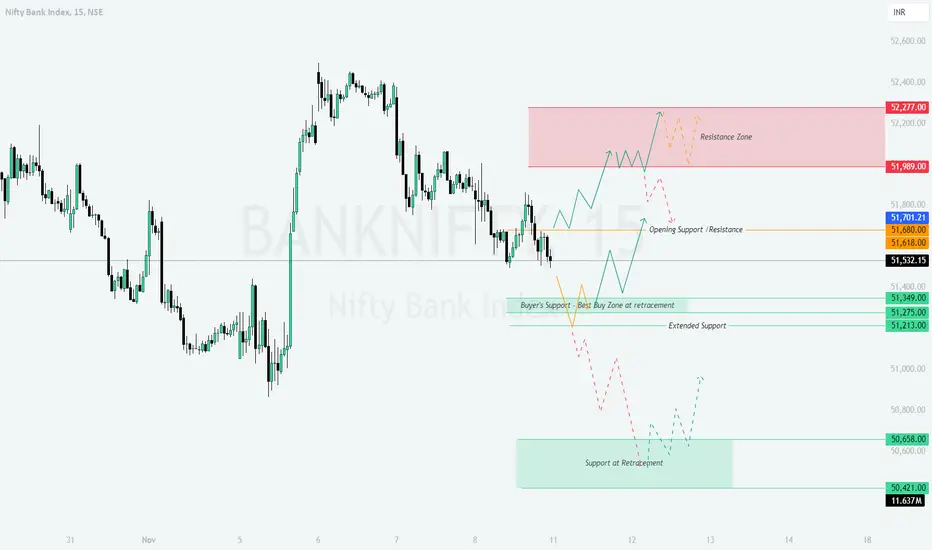
On the previous trading day, Bank Nifty exhibited distinct zones for resistance, support, and retracement areas, giving us a clear range to work with. The yellow trend lines represent periods of sideways movement, green indicates a bullish trend, and red represents a bearish trend. Key resistance is observed around 52,277, while support is at 51,275. Here’s a detailed plan based on possible opening scenarios.
---
Trading Plan for All Opening Scenarios:
- Gap Up Opening (200+ Points):
- If Bank Nifty opens with a gap up above the Resistance Zone at 51,989, monitor if it sustains above this level in the first 15-30 minutes.
- Bullish Scenario: A sustained move above 51,989 can lead to a bullish trend toward the higher Resistance Zone at 52,277. Look for buying opportunities on pullbacks toward 51,989 for a potential upside move.
- Bearish Scenario: If it fails to hold above 51,989 and reverses, expect a retracement toward the Opening Support/Resistance at 51,680. Consider short entries below 51,989 with a target toward 51,680 if bearish momentum persists.
- Flat Opening:
- If Bank Nifty opens flat around 51,532, wait for the price to stabilize for the first 15-30 minutes before taking any positions.
- Bullish Scenario: A move above 51,680 can trigger a bullish trend with targets toward 51,989. Look for buying entries around 51,680 with support from price action.
- Bearish Scenario: If Bank Nifty breaks below 51,349, expect bearish pressure with targets around the Extended Support at 51,213. Short entries could be considered below 51,349 if bearish signals confirm.
- Gap Down Opening (200+ Points):
- A gap down opening below 51,349 could lead to early volatility. Watch if it stabilizes around the Buyer’s Support zone at 51,275.
- Bullish Scenario: If Bank Nifty holds above 51,275 and shows a reversal, consider going long with targets toward the Opening Support at 51,532.
- Bearish Scenario: If selling pressure continues and Bank Nifty breaks below 51,275, expect a move toward the lower Support at Retracement near 50,658. Look for short opportunities below 51,275 with a strict stop loss above 51,275.
---
Risk Management Tips for Options Trading:
- Use hedged positions like vertical spreads to manage risk effectively.
- Maintain a stop-loss level based on daily close to avoid getting stopped out due to intraday volatility.
- Limit position sizes based on your risk tolerance; do not over-leverage.
- Avoid chasing targets; exit around target zones to lock in profits.
---
Summary and Conclusion:
The market structure offers key levels to watch for both support and resistance. Sustaining above 51,989 could signal a bullish move, while a breakdown below 51,275 could lead to further downside. Exercise patience, wait for confirmation around these levels, and manage risk prudently.
---
Disclaimer:
I am not a SEBI-registered analyst. This plan is for educational purposes only. Please perform your analysis or consult a financial advisor before making any trading decisions.
免責事項
これらの情報および投稿は、TradingViewが提供または保証する金融、投資、取引、またはその他の種類のアドバイスや推奨を意図したものではなく、またそのようなものでもありません。詳しくは利用規約をご覧ください。
免責事項
これらの情報および投稿は、TradingViewが提供または保証する金融、投資、取引、またはその他の種類のアドバイスや推奨を意図したものではなく、またそのようなものでもありません。詳しくは利用規約をご覧ください。