🔎 Intro / Overview
___________________________________________________________
📌 How to Use
___________________________________________________________
🎯 Trading Plan
___________________________________________________________
📊 Chart Explanation
___________________________________________________________
👀 Observation
___________________________________________________________
❗ Why It Matters?
___________________________________________________________
🎯 Conclusion
___________________________________________________________
⚠️ Disclaimer
- The Bullish Ascending Triangle is a continuation pattern that signals strength in an uptrend 📈.
- It forms as price creates Higher Highs and Higher Lows in sequence, compressing toward a breakout level.
- This structure shows buyers stepping in at higher levels while sellers gradually weaken, often leading to a bullish breakout.
___________________________________________________________
📌 How to Use
- Identify a prior uptrend → the base condition for Ascending Triangle.
- Price consolidates by forming Higher Lows and retesting the same resistance level.
- Validation → Mark the close of candle that break upper trend line
- Devalidation → Swing Low ( when any candle break the upper trend line).
- Entry → Confirmed only when price closes above the Validation level.
- Stop Loss → Swing Low (Candle break the upper trend line ).
- Target → Equal to the measured height of the triangle or 1R multiples.
___________________________________________________________
🎯 Trading Plan
- Entry → On breakout close above Validation level.
- Stop Loss → Swing Low (Candle break the upper trend line ).
- Target → Conservative 1R, Moderate 2R,
- Remaining lots → Trail using ATR, Fibonacci, or structural swing highs.
___________________________________________________________
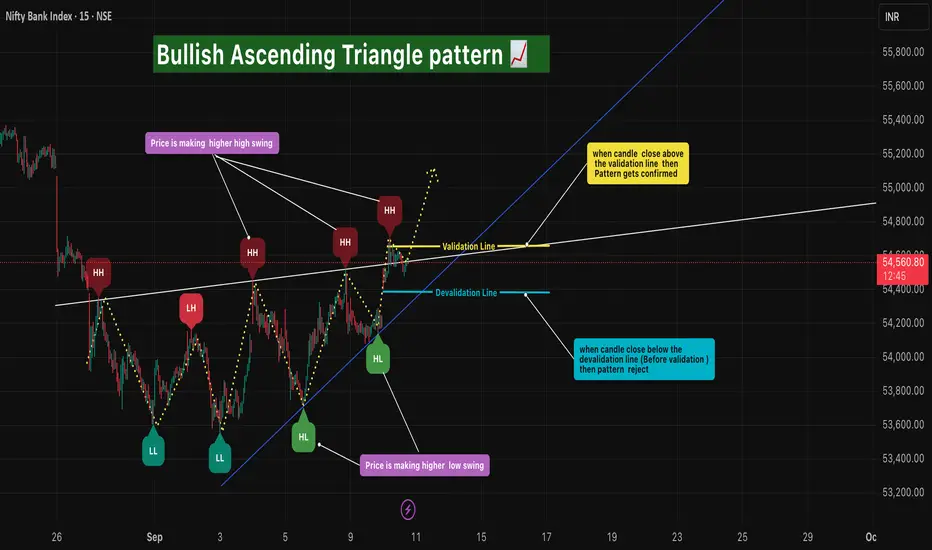
📊 Chart Explanation
- Price starts in an uptrend.
- Forms a sequence of Higher Highs and Higher Lows.
- Resistance holds flat at the top, forming the Ascending Triangle shape 🔺.
- Breakout above the Higher High Validation line triggers entry ✅.
- Swing Low = Devalidation ⛔.
- Target 1 achieved 🎯, trailing used for further upside 🚀.
___________________________________________________________
👀 Observation
- Works best as a continuation pattern in established uptrends.
- A strong bullish breakout candle adds conviction.
- Sideways/choppy markets may cause false breakouts → validation rules filter them.
- Volume confirmation strengthens the setup.
___________________________________________________________
❗ Why It Matters?
- Represents buyer dominance with sellers weakening over time.
- Provides a clear breakout entry with strict SL and TP.
- Helps traders capture trending moves while minimizing false signals.
- Rule-based framework improves discipline and consistency.
___________________________________________________________
🎯 Conclusion
- The Bullish Ascending Triangle Pattern is a reliable continuation signal for trend traders.
- By combining Higher Highs, Higher Lows, and breakout confirmation, traders can enter with confidence, manage risk, and trail profits effectively.
- 🔥 Patterns don’t predict. Rules protect. 🚀
___________________________________________________________
⚠️ Disclaimer
📘 For educational purposes only.
🙅 Not SEBI registered.
❌ Not a buy/sell recommendation.
🧠 Purely a learning resource.
📊 Not Financial Advice.
ノート
On 11 September, 2025 (12:15) ⏰, the Entry was successfully validated ✅. - 📌 Stop Loss (SL) → Swing Low = 54,400.00
- 🎯 Target 1 → 1x of Stop Loss distance = 55,022.20
The setup is now active with structured risk management.
ノート
-🎯 The projected target of 55,065 has been successfully achieved today.
-📈 This target was anticipated on 10 September during the pattern validation.
-🔄 Remaining positions can now be managed with a trailing stop to protect profits while allowing further upside potential.
免責事項
これらの情報および投稿は、TradingViewが提供または保証する金融、投資、取引、またはその他の種類のアドバイスや推奨を意図したものではなく、またそのようなものでもありません。詳しくは利用規約をご覧ください。
免責事項
これらの情報および投稿は、TradingViewが提供または保証する金融、投資、取引、またはその他の種類のアドバイスや推奨を意図したものではなく、またそのようなものでもありません。詳しくは利用規約をご覧ください。