🔎 Multi-Timeframe Analysis
4H Chart
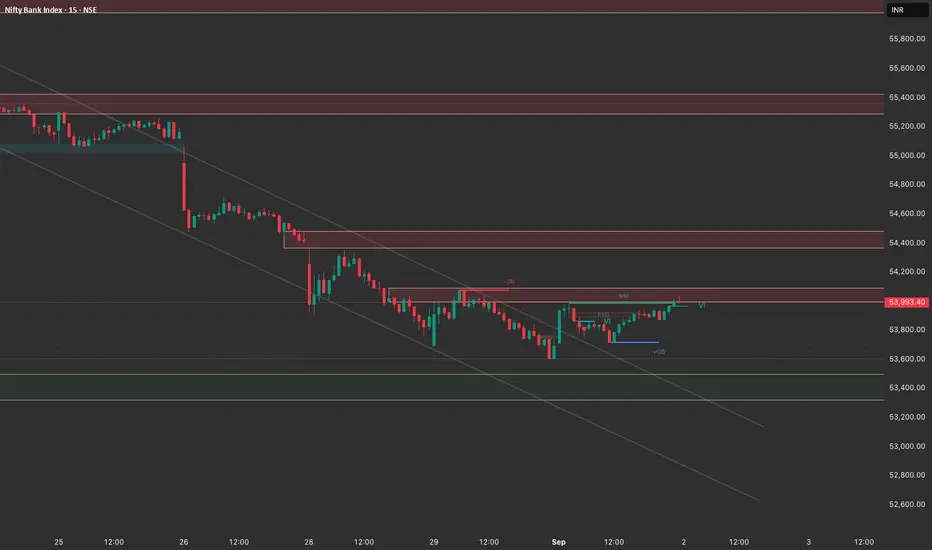
Trend: Strong bearish structure intact, price consistently making lower lows.
Current Action: Price has bounced from 53,400 demand zone and is now testing supply around 54,000–54,200 (FVG + supply block).
Bias: Still bearish overall, but short-term relief rally is underway until this supply zone holds.
1H Chart
Trend: Recovery move inside a descending channel. Recent candles show strength but hitting 54,000 resistance zone.
Supply: 54,000–54,200 is a critical supply block. Above this, next resistance at 54,400–54,500.
Demand: Strong support sits near 53,400–53,500.
15M Chart
Structure: Clear break above intraday structure with higher highs and higher lows.
Immediate Resistance: Price is consolidating just below 54,000–54,100 supply.
Short-term Bias: Momentum bullish, but into heavy resistance.
🎯 Trade Plan for 2nd September
🔹 Scenario 1: Rejection at 54,000–54,200
If price rejects this supply zone with bearish candle confirmation:
Entry: Short near 54,000–54,100
Target 1: 53,700
Target 2: 53,400 (major demand zone)
Stop-Loss: Above 54,250
✅ Favorable Risk-Reward for trend continuation.
🔹 Scenario 2: Breakout above 54,200
If price sustains above 54,200 with volume:
Entry: Long above 54,250
Target 1: 54,500
Target 2: 54,800
Stop-Loss: Below 54,000
⚠️ More counter-trend, so reduce size.
🔹 Scalping Intraday (15M Setup)
Look for short entries at 54,000–54,100 zone rejection.
Quick longs possible only if 53,700–53,750 holds intraday as support.
📌 Summary:
Bigger picture = bearish bias.
Best probability = Sell on rise around 54,000–54,200.
Bulls only valid above 54,200 for a short-covering rally.
4H Chart
Trend: Strong bearish structure intact, price consistently making lower lows.
Current Action: Price has bounced from 53,400 demand zone and is now testing supply around 54,000–54,200 (FVG + supply block).
Bias: Still bearish overall, but short-term relief rally is underway until this supply zone holds.
1H Chart
Trend: Recovery move inside a descending channel. Recent candles show strength but hitting 54,000 resistance zone.
Supply: 54,000–54,200 is a critical supply block. Above this, next resistance at 54,400–54,500.
Demand: Strong support sits near 53,400–53,500.
15M Chart
Structure: Clear break above intraday structure with higher highs and higher lows.
Immediate Resistance: Price is consolidating just below 54,000–54,100 supply.
Short-term Bias: Momentum bullish, but into heavy resistance.
🎯 Trade Plan for 2nd September
🔹 Scenario 1: Rejection at 54,000–54,200
If price rejects this supply zone with bearish candle confirmation:
Entry: Short near 54,000–54,100
Target 1: 53,700
Target 2: 53,400 (major demand zone)
Stop-Loss: Above 54,250
✅ Favorable Risk-Reward for trend continuation.
🔹 Scenario 2: Breakout above 54,200
If price sustains above 54,200 with volume:
Entry: Long above 54,250
Target 1: 54,500
Target 2: 54,800
Stop-Loss: Below 54,000
⚠️ More counter-trend, so reduce size.
🔹 Scalping Intraday (15M Setup)
Look for short entries at 54,000–54,100 zone rejection.
Quick longs possible only if 53,700–53,750 holds intraday as support.
📌 Summary:
Bigger picture = bearish bias.
Best probability = Sell on rise around 54,000–54,200.
Bulls only valid above 54,200 for a short-covering rally.
免責事項
この情報および投稿は、TradingViewが提供または推奨する金融、投資、トレード、その他のアドバイスや推奨を意図するものではなく、それらを構成するものでもありません。詳細は利用規約をご覧ください。
免責事項
この情報および投稿は、TradingViewが提供または推奨する金融、投資、トレード、その他のアドバイスや推奨を意図するものではなく、それらを構成するものでもありません。詳細は利用規約をご覧ください。