🔎 Market Structure Analysis
4H Chart (Swing Bias)
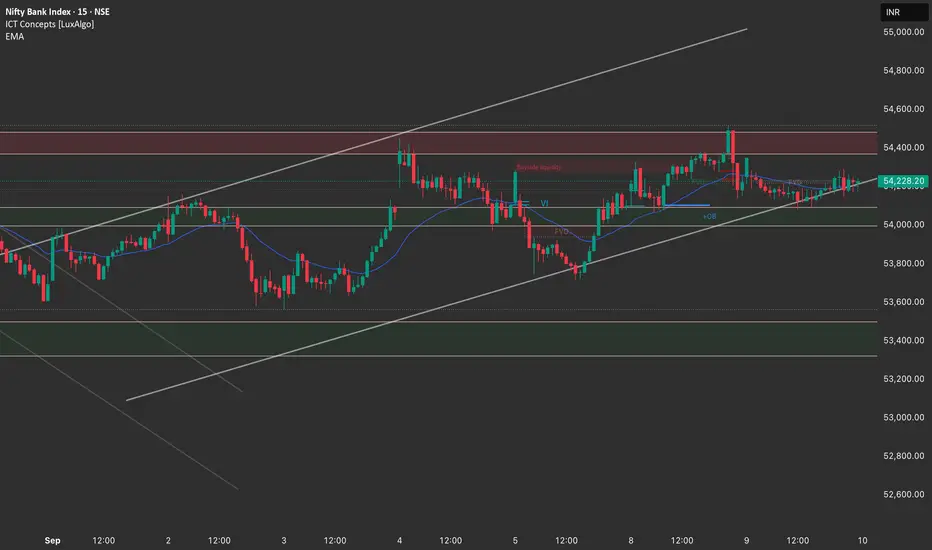
Price is consolidating within a rising channel but facing strong supply zone near 54,400–54,600.
Multiple rejections seen in this area → clear sign of overhead resistance.
Demand zones visible around 54,000 and 53,600, where buyers have previously defended.
Structure: Still range-bound between 53,600 – 54,600, leaning towards distribution near resistance.
1H Chart (Intraday Bias)
Market attempted a breakout above 54,400 but failed, creating a liquidity grab at the top.
Price retested mid-range support (~54,000–54,100) and is currently holding trendline support.
Multiple FVGs left below 54,000 → risk of price revisiting those zones if momentum fails.
Bias: Cautious long only above 54,400; otherwise, sideways with bearish pressure if breakdown happens.
15M Chart (Execution Zone)
Clear rejection candle from supply zone 54,400–54,500.
Small order block support formed at ~54,100.
Upside liquidity resting above 54,600, downside liquidity resting below 53,900.
Ideal trade setup will depend on whether price breaks below 54,100 or sustains above 54,400.
📌 Trade Plan for 10th September
Bullish Scenario (if strength holds)
Entry: Long only above 54,400 (confirmation candle).
Targets: 54,600 → 54,800.
Stoploss: Below 54,150.
Reasoning: Breakout + liquidity sweep above supply zone.
Bearish Scenario (preferred if rejection continues)
Entry: Short near 54,300–54,400 rejection zone.
Targets: 54,050 → 53,800 → 53,600.
Stoploss: Above 54,500.
Reasoning: Rejection from strong supply + FVGs below to be filled.
Neutral / Sideways Plan
If price stays stuck between 54,100–54,400, avoid aggressive trades.
Range scalping possible:
Buy near 54,100 demand with tight SL.
Sell near 54,400 supply with tight SL.
✅ Bias Summary: BankNifty is range-bound with bearish tilt unless it gives a strong breakout above 54,400. Safer to look for shorts from supply until clear evidence of breakout comes.
4H Chart (Swing Bias)
Price is consolidating within a rising channel but facing strong supply zone near 54,400–54,600.
Multiple rejections seen in this area → clear sign of overhead resistance.
Demand zones visible around 54,000 and 53,600, where buyers have previously defended.
Structure: Still range-bound between 53,600 – 54,600, leaning towards distribution near resistance.
1H Chart (Intraday Bias)
Market attempted a breakout above 54,400 but failed, creating a liquidity grab at the top.
Price retested mid-range support (~54,000–54,100) and is currently holding trendline support.
Multiple FVGs left below 54,000 → risk of price revisiting those zones if momentum fails.
Bias: Cautious long only above 54,400; otherwise, sideways with bearish pressure if breakdown happens.
15M Chart (Execution Zone)
Clear rejection candle from supply zone 54,400–54,500.
Small order block support formed at ~54,100.
Upside liquidity resting above 54,600, downside liquidity resting below 53,900.
Ideal trade setup will depend on whether price breaks below 54,100 or sustains above 54,400.
📌 Trade Plan for 10th September
Bullish Scenario (if strength holds)
Entry: Long only above 54,400 (confirmation candle).
Targets: 54,600 → 54,800.
Stoploss: Below 54,150.
Reasoning: Breakout + liquidity sweep above supply zone.
Bearish Scenario (preferred if rejection continues)
Entry: Short near 54,300–54,400 rejection zone.
Targets: 54,050 → 53,800 → 53,600.
Stoploss: Above 54,500.
Reasoning: Rejection from strong supply + FVGs below to be filled.
Neutral / Sideways Plan
If price stays stuck between 54,100–54,400, avoid aggressive trades.
Range scalping possible:
Buy near 54,100 demand with tight SL.
Sell near 54,400 supply with tight SL.
✅ Bias Summary: BankNifty is range-bound with bearish tilt unless it gives a strong breakout above 54,400. Safer to look for shorts from supply until clear evidence of breakout comes.
免責事項
この情報および投稿は、TradingViewが提供または推奨する金融、投資、トレード、その他のアドバイスや推奨を意図するものではなく、それらを構成するものでもありません。詳細は利用規約をご覧ください。
免責事項
この情報および投稿は、TradingViewが提供または推奨する金融、投資、トレード、その他のアドバイスや推奨を意図するものではなく、それらを構成するものでもありません。詳細は利用規約をご覧ください。