🔵 BankNifty Analysis (as of 28th July close)
🧠 Market Context
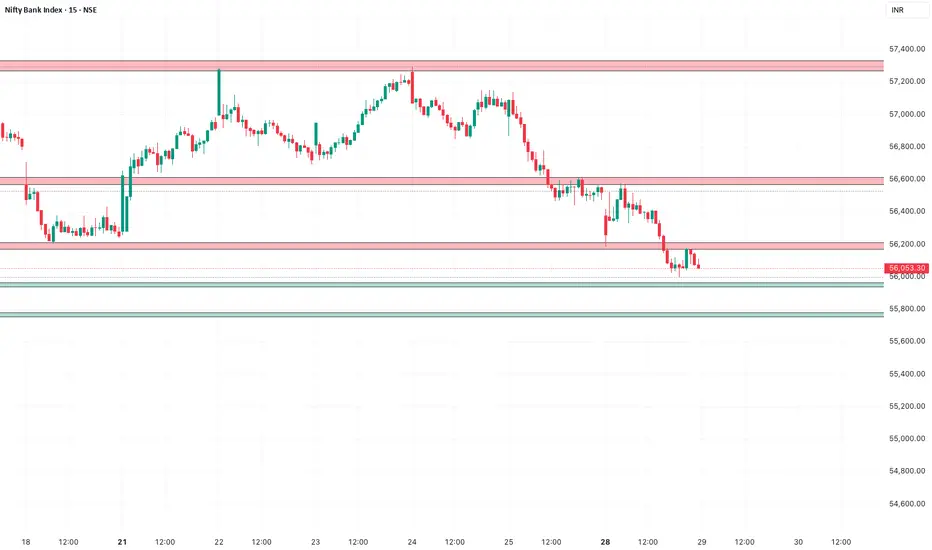
Price is currently around 56,050, sitting right on a key demand support zone between 56,000–56,200.
The higher timeframe (4H & 1H) structure remains bearish, with a series of lower highs and lower lows.
Price has broken below the mid-range support (56,200) and is retesting it.
If this zone fails, the next strong demand is near 55,800–55,900.
Supply zones above remain heavy, especially between 56,600–57,200.
📌 Market Structure (4H & 1H Combined)
Trend Bias: Bearish
4H:
Lower highs and lower lows intact.
Strong supply overhead at 57,000–57,300.
Demand holding weakly at 56,000–56,200.
1H:
Price consolidating at demand after a sharp sell-off.
No sign of a reversal yet; bounce attempts look corrective.
🗺️ Key Zones
Immediate Resistance (Supply)
56,600–56,800 (minor supply)
57,000–57,200 (major supply)
Immediate Support (Demand)
56,000–56,200 (current demand; being tested)
55,800–55,900 (next strong demand)
No Trade Zone
Between 56,200–56,400 → choppy, whipsaw risk.
📈 Trade Plan
Scenario 1 – Sell on Pullback (Preferred Bias)
Entry: Near 56,400–56,500 on rejection (15min bearish pattern)
SL: Above 56,650
Targets: 56,000 → 55,850
Scenario 2 – Breakdown Sell
If 56,000 breaks with volume
Entry: 55,950
SL: Above 56,200
Targets: 55,800 → 55,650
Scenario 3 – Countertrend Buy (Aggressive)
Only if 56,000 demand shows strong rejection with 15min bullish engulfing
Entry: 56,050–56,100
SL: Below 55,900
Targets: 56,400 → 56,600
(Low probability, high risk — not preferred unless clear confirmation).
✅ Bias for Tomorrow: Sell on rallies towards 56,400–56,500 unless strong demand rejection appears at 56,000.
🧠 Market Context
Price is currently around 56,050, sitting right on a key demand support zone between 56,000–56,200.
The higher timeframe (4H & 1H) structure remains bearish, with a series of lower highs and lower lows.
Price has broken below the mid-range support (56,200) and is retesting it.
If this zone fails, the next strong demand is near 55,800–55,900.
Supply zones above remain heavy, especially between 56,600–57,200.
📌 Market Structure (4H & 1H Combined)
Trend Bias: Bearish
4H:
Lower highs and lower lows intact.
Strong supply overhead at 57,000–57,300.
Demand holding weakly at 56,000–56,200.
1H:
Price consolidating at demand after a sharp sell-off.
No sign of a reversal yet; bounce attempts look corrective.
🗺️ Key Zones
Immediate Resistance (Supply)
56,600–56,800 (minor supply)
57,000–57,200 (major supply)
Immediate Support (Demand)
56,000–56,200 (current demand; being tested)
55,800–55,900 (next strong demand)
No Trade Zone
Between 56,200–56,400 → choppy, whipsaw risk.
📈 Trade Plan
Scenario 1 – Sell on Pullback (Preferred Bias)
Entry: Near 56,400–56,500 on rejection (15min bearish pattern)
SL: Above 56,650
Targets: 56,000 → 55,850
Scenario 2 – Breakdown Sell
If 56,000 breaks with volume
Entry: 55,950
SL: Above 56,200
Targets: 55,800 → 55,650
Scenario 3 – Countertrend Buy (Aggressive)
Only if 56,000 demand shows strong rejection with 15min bullish engulfing
Entry: 56,050–56,100
SL: Below 55,900
Targets: 56,400 → 56,600
(Low probability, high risk — not preferred unless clear confirmation).
✅ Bias for Tomorrow: Sell on rallies towards 56,400–56,500 unless strong demand rejection appears at 56,000.
免責事項
この情報および投稿は、TradingViewが提供または推奨する金融、投資、トレード、その他のアドバイスや推奨を意図するものではなく、それらを構成するものでもありません。詳細は利用規約をご覧ください。
免責事項
この情報および投稿は、TradingViewが提供または推奨する金融、投資、トレード、その他のアドバイスや推奨を意図するものではなく、それらを構成するものでもありません。詳細は利用規約をご覧ください。