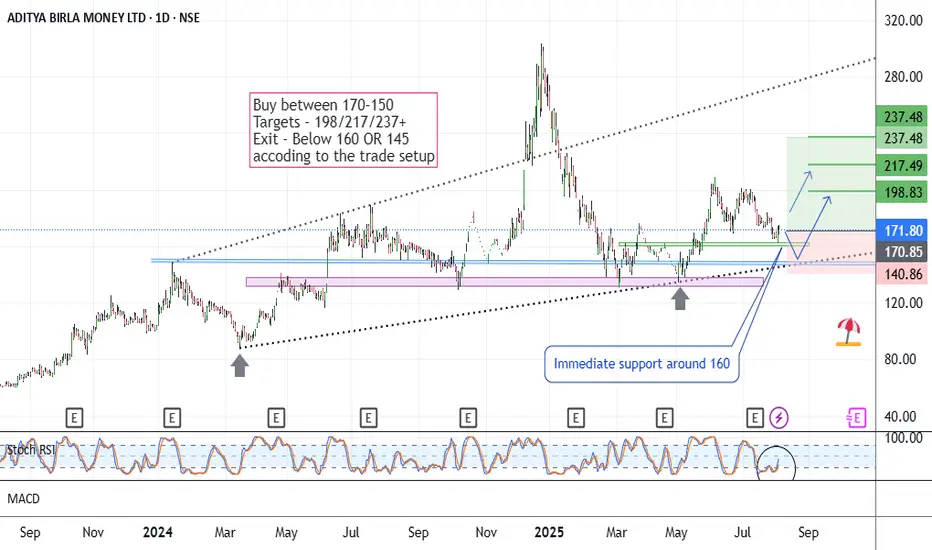
CMP 171.80 on 04.08.25
The chart is self-explanatory. Resistances and supports are mentioned according to the setup. Immediate support seems to be around 160, whereas the lower support area is around 148.
Stochastic RSI is trying to rise at present.
If it goes upward, targets may be 217, 237, or more.
Entry-level and position size should be considered according to the exit price (if going at a loss).
If it sustains below 145, this setup will go weak.
This illustration is purely my own view, for learning and sharing purposes only. This is not buying or selling advice, as I am not a registered analyst.
All the best.
免責事項
これらの情報および投稿は、TradingViewが提供または保証する金融、投資、取引、またはその他の種類のアドバイスや推奨を意図したものではなく、またそのようなものでもありません。詳しくは利用規約をご覧ください。
免責事項
これらの情報および投稿は、TradingViewが提供または保証する金融、投資、取引、またはその他の種類のアドバイスや推奨を意図したものではなく、またそのようなものでもありません。詳しくは利用規約をご覧ください。