Timeframe: Daily Chart | Analysis Type: Pure Price Action
🎯 Idea Summary
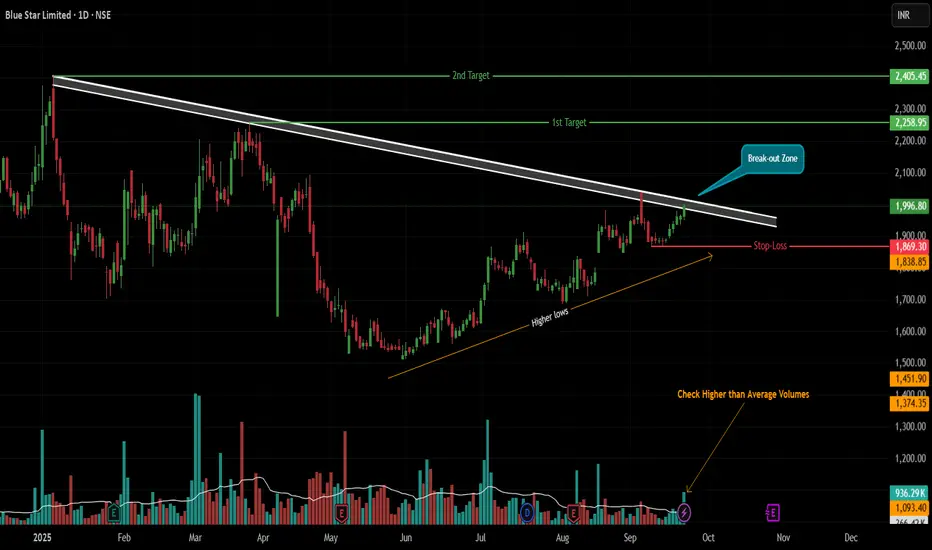
BLUESTAR is showcasing a textbook-perfect technical setup! A multi-month Descending Trendline resistance is converging with a bullish series of Higher Lows, forming a tight Volume Contraction Pattern (VCP). The stock is now squeezing at the apex, suggesting a powerful explosive move is on the horizon. A confirmed breakout could signal the start of a major bullish wave!
📊 Technical Rationale (Pure Price Action)
⚡ Major Descending Trendline (Resistance):
This key trendline originates from the swing high on 6th January 2025 📅.
It has been tested and respected as strong resistance on 25th March, 4th September, and 22nd September 2025. Each touch confirms the selling pressure. A breakout signifies a major trend reversal.
💪 Bullish Higher Lows & VCP (Strength):
Since 2nd June 2025, the stock has crafted a beautiful series of Higher Lows (HL) ↗️.
This shows buyers are aggressively defending higher levels, building a solid base for the next leg up. The contraction in price swings forms a Volume Contraction Pattern (VCP), indicating energy compression before a big expansion.
🧨 The Convergence (The Trigger):
Price is now knocking at the trendline resistance again. The coiling action is ultra-tight, suggesting a high-potential breakout is imminent!
⚖️ Trade Strategy
✅ Trigger for Entry: A BUY is triggered ONLY on a strong daily candle CLOSE ABOVE the descending trendline.
🔍 Confirmation Criteria (CRITICAL):
1) Volume: The breakout must be on VERY HIGH volume 📈. This is non-negotiable to confirm real buying interest and avoid fakeouts.
2) Candle Strength: The perfect signal is a thick, green Marubozu candle 🟢 (strong buying from open to close).
🛡️ Stop Loss (SL):
Aggressive: Low of the breakout candle.
Positional/Conservative: 1869 (The anchor of the HL structure).
🎯 Price Targets:
Target 1: 2258
Target 2: 2405
📌 Management: After T1, trail your stop loss to lock in profits on the way to T2.
⚠️ Key Considerations
⏳ Patience is a Virtue: Wait for the daily candle to CLOSE above the trendline. No premature entries!
🚫 False Breakout Risk: A weak close or low volume is a red flag. Stick to the rules.
✨ Pure Price Action: No lagging indicators. Just clean supply/demand analysis.
Disclaimer: This is an educational idea and not financial advice. Trading carries risk. Always do your own research and manage risk appropriately.
✨ Let me know if you spot the setup! Good luck and trade safe! ✨
🎯 Idea Summary
BLUESTAR is showcasing a textbook-perfect technical setup! A multi-month Descending Trendline resistance is converging with a bullish series of Higher Lows, forming a tight Volume Contraction Pattern (VCP). The stock is now squeezing at the apex, suggesting a powerful explosive move is on the horizon. A confirmed breakout could signal the start of a major bullish wave!
📊 Technical Rationale (Pure Price Action)
⚡ Major Descending Trendline (Resistance):
This key trendline originates from the swing high on 6th January 2025 📅.
It has been tested and respected as strong resistance on 25th March, 4th September, and 22nd September 2025. Each touch confirms the selling pressure. A breakout signifies a major trend reversal.
💪 Bullish Higher Lows & VCP (Strength):
Since 2nd June 2025, the stock has crafted a beautiful series of Higher Lows (HL) ↗️.
This shows buyers are aggressively defending higher levels, building a solid base for the next leg up. The contraction in price swings forms a Volume Contraction Pattern (VCP), indicating energy compression before a big expansion.
🧨 The Convergence (The Trigger):
Price is now knocking at the trendline resistance again. The coiling action is ultra-tight, suggesting a high-potential breakout is imminent!
⚖️ Trade Strategy
✅ Trigger for Entry: A BUY is triggered ONLY on a strong daily candle CLOSE ABOVE the descending trendline.
🔍 Confirmation Criteria (CRITICAL):
1) Volume: The breakout must be on VERY HIGH volume 📈. This is non-negotiable to confirm real buying interest and avoid fakeouts.
2) Candle Strength: The perfect signal is a thick, green Marubozu candle 🟢 (strong buying from open to close).
🛡️ Stop Loss (SL):
Aggressive: Low of the breakout candle.
Positional/Conservative: 1869 (The anchor of the HL structure).
🎯 Price Targets:
Target 1: 2258
Target 2: 2405
📌 Management: After T1, trail your stop loss to lock in profits on the way to T2.
⚠️ Key Considerations
⏳ Patience is a Virtue: Wait for the daily candle to CLOSE above the trendline. No premature entries!
🚫 False Breakout Risk: A weak close or low volume is a red flag. Stick to the rules.
✨ Pure Price Action: No lagging indicators. Just clean supply/demand analysis.
Disclaimer: This is an educational idea and not financial advice. Trading carries risk. Always do your own research and manage risk appropriately.
✨ Let me know if you spot the setup! Good luck and trade safe! ✨
免責事項
これらの情報および投稿は、TradingViewが提供または保証する金融、投資、取引、またはその他の種類のアドバイスや推奨を意図したものではなく、またそのようなものでもありません。詳しくは利用規約をご覧ください。
免責事項
これらの情報および投稿は、TradingViewが提供または保証する金融、投資、取引、またはその他の種類のアドバイスや推奨を意図したものではなく、またそのようなものでもありません。詳しくは利用規約をご覧ください。