BNB Analysis: Key Levels to Watch for the Next Move 24.12.31
Hello, this is Greedy All-Day.
Today's analysis focuses on BNB.
Review of the Previous Analysis

Let’s start by reviewing the previous analysis.
In the last analysis, I mentioned that if the red box resistance trendline is broken to the upside, there is a high probability of the price rising to the next supply zone.
The price initially faced resistance at the 720 level (first resistance), retraced slightly, but eventually broke through and rose to the upper boundary of the blue box supply zone at 731.
The resistance occurred at the green box high within the blue box.
Subsequently, the price failed to break the high, leading to a corrective phase.
BNB Chart from a Buy Perspective

From the daily chart, the resistance trendline has been drawn, extending from previous highs.
For new buy entries, it would be safer to wait for a breakout above the 738 level (red box).
Currently, with Bitcoin in a corrective phase and altcoins also struggling, entering at uncertain levels should be avoided.
If the price breaks above 738, a retest of the high—similar to what happened in the yellow box on the left—could occur, with a potential rise at least to the blue box supply zone.
BNB Chart from a Sell Perspective
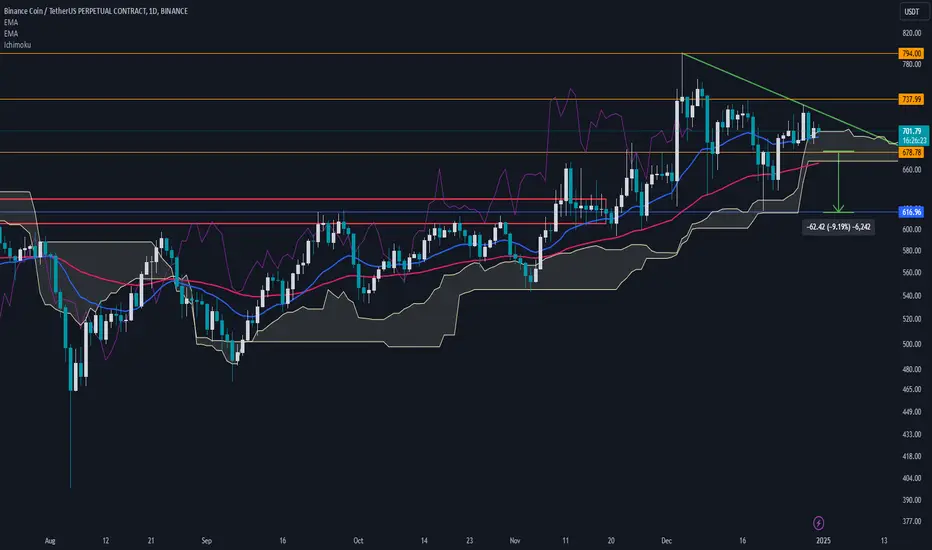
Since the bullish candle on December 23, 2024, the price has consistently held above the 678.78 level.
If the red box is broken to the downside, the price could either create a long lower wick, as seen in the yellow box, or experience a complete fill, resulting in a significant decline.
Additional Evidence

The yellow box and the current high are similar, with a one-way drop previously resulting in a test of the 617 support level.
As of now, the 617 level, which acted as resistance from June 2024 to November 2024, has turned into support.
If the price drops, there’s a possibility of a 10% correction, with a one-way decline toward 617.
Conclusion
BNB is currently at a critical juncture. While there are opportunities for both upward and downward moves, waiting for confirmed breakouts or breakdowns will be key to minimizing risk and maximizing profit potential.
Today's analysis focuses on BNB.
Review of the Previous Analysis
Let’s start by reviewing the previous analysis.
In the last analysis, I mentioned that if the red box resistance trendline is broken to the upside, there is a high probability of the price rising to the next supply zone.
The price initially faced resistance at the 720 level (first resistance), retraced slightly, but eventually broke through and rose to the upper boundary of the blue box supply zone at 731.
The resistance occurred at the green box high within the blue box.
Subsequently, the price failed to break the high, leading to a corrective phase.
BNB Chart from a Buy Perspective
From the daily chart, the resistance trendline has been drawn, extending from previous highs.
For new buy entries, it would be safer to wait for a breakout above the 738 level (red box).
Currently, with Bitcoin in a corrective phase and altcoins also struggling, entering at uncertain levels should be avoided.
If the price breaks above 738, a retest of the high—similar to what happened in the yellow box on the left—could occur, with a potential rise at least to the blue box supply zone.
BNB Chart from a Sell Perspective
Since the bullish candle on December 23, 2024, the price has consistently held above the 678.78 level.
If the red box is broken to the downside, the price could either create a long lower wick, as seen in the yellow box, or experience a complete fill, resulting in a significant decline.
Additional Evidence
The yellow box and the current high are similar, with a one-way drop previously resulting in a test of the 617 support level.
As of now, the 617 level, which acted as resistance from June 2024 to November 2024, has turned into support.
If the price drops, there’s a possibility of a 10% correction, with a one-way decline toward 617.
Conclusion
BNB is currently at a critical juncture. While there are opportunities for both upward and downward moves, waiting for confirmed breakouts or breakdowns will be key to minimizing risk and maximizing profit potential.
関連の投稿
免責事項
これらの情報および投稿は、TradingViewが提供または保証する金融、投資、取引、またはその他の種類のアドバイスや推奨を意図したものではなく、またそのようなものでもありません。詳しくは利用規約をご覧ください。
免責事項
これらの情報および投稿は、TradingViewが提供または保証する金融、投資、取引、またはその他の種類のアドバイスや推奨を意図したものではなく、またそのようなものでもありません。詳しくは利用規約をご覧ください。