🔎 Multi-Timeframe Market Structure
4H Chart
Price is still respecting the descending channel.
Recent rejection came right from the channel supply + OB zone ~81,600–81,800.
Support demand holds near 80,600–80,750, which has been tested multiple times.
Market is consolidating between 80,600–81,600.
Bias: Range-bound inside larger downtrend. Unless 81,800 breaks, structure remains corrective.
1H Chart
Clear swing high rejection at 81,600.
Price retraced to FVG + demand block around 80,700–80,800, and bounced.
Currently trading near 81,100–81,200 (mid-channel zone).
Liquidity pools visible above 81,600 (short-trap potential).
Bias: Intraday bullish bias from demand zones, but still capped by channel supply.
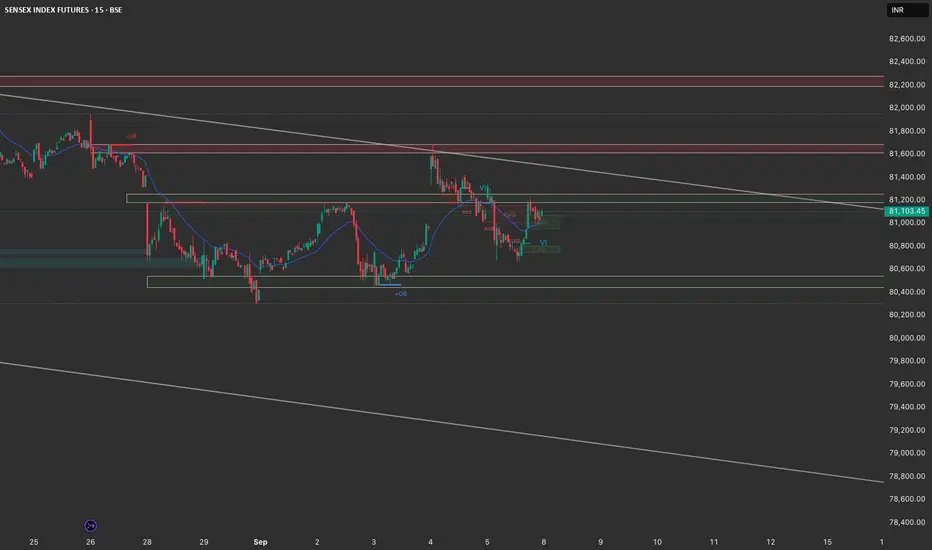
15M Chart
Short-term MSB → BOS → Retest seen near 80,700.
Price is consolidating just below minor resistance 81,200–81,300.
Imbalances (FVG) left around 80,900–81,000 may get filled if market dips.
Bias: Short-term bullish continuation possible, but supply zones overhead are heavy.
📊 Trade Plan (Next Session)
Bullish Scenario (if demand holds 80,700–80,900)
Entry: 80,900–81,000 (on retest/fill of imbalance).
Targets:
TP1 → 81,300 (minor resistance).
TP2 → 81,600–81,800 (channel supply + OB).
Stop: Below 80,650.
Bearish Scenario (if rejection continues at 81,300–81,600)
Entry: 81,200–81,400 zone (look for rejection candle).
Targets:
TP1 → 80,900.
TP2 → 80,600–80,500 (major demand).
Stop: Above 81,650.
🎯 Summary
Intraday bias: Mildly bullish until 81,600–81,800 is tested.
Swing bias: Still bearish inside descending channel unless a clear breakout >81,800–82,000 occurs.
Best trade idea: Buy dips around 80,900–81,000 with TP towards 81,600, then watch for reversal signs.
4H Chart
Price is still respecting the descending channel.
Recent rejection came right from the channel supply + OB zone ~81,600–81,800.
Support demand holds near 80,600–80,750, which has been tested multiple times.
Market is consolidating between 80,600–81,600.
Bias: Range-bound inside larger downtrend. Unless 81,800 breaks, structure remains corrective.
1H Chart
Clear swing high rejection at 81,600.
Price retraced to FVG + demand block around 80,700–80,800, and bounced.
Currently trading near 81,100–81,200 (mid-channel zone).
Liquidity pools visible above 81,600 (short-trap potential).
Bias: Intraday bullish bias from demand zones, but still capped by channel supply.
15M Chart
Short-term MSB → BOS → Retest seen near 80,700.
Price is consolidating just below minor resistance 81,200–81,300.
Imbalances (FVG) left around 80,900–81,000 may get filled if market dips.
Bias: Short-term bullish continuation possible, but supply zones overhead are heavy.
📊 Trade Plan (Next Session)
Bullish Scenario (if demand holds 80,700–80,900)
Entry: 80,900–81,000 (on retest/fill of imbalance).
Targets:
TP1 → 81,300 (minor resistance).
TP2 → 81,600–81,800 (channel supply + OB).
Stop: Below 80,650.
Bearish Scenario (if rejection continues at 81,300–81,600)
Entry: 81,200–81,400 zone (look for rejection candle).
Targets:
TP1 → 80,900.
TP2 → 80,600–80,500 (major demand).
Stop: Above 81,650.
🎯 Summary
Intraday bias: Mildly bullish until 81,600–81,800 is tested.
Swing bias: Still bearish inside descending channel unless a clear breakout >81,800–82,000 occurs.
Best trade idea: Buy dips around 80,900–81,000 with TP towards 81,600, then watch for reversal signs.
免責事項
これらの情報および投稿は、TradingViewが提供または保証する金融、投資、取引、またはその他の種類のアドバイスや推奨を意図したものではなく、またそのようなものでもありません。詳しくは利用規約をご覧ください。
免責事項
これらの情報および投稿は、TradingViewが提供または保証する金融、投資、取引、またはその他の種類のアドバイスや推奨を意図したものではなく、またそのようなものでもありません。詳しくは利用規約をご覧ください。