From a purely technical standpoint
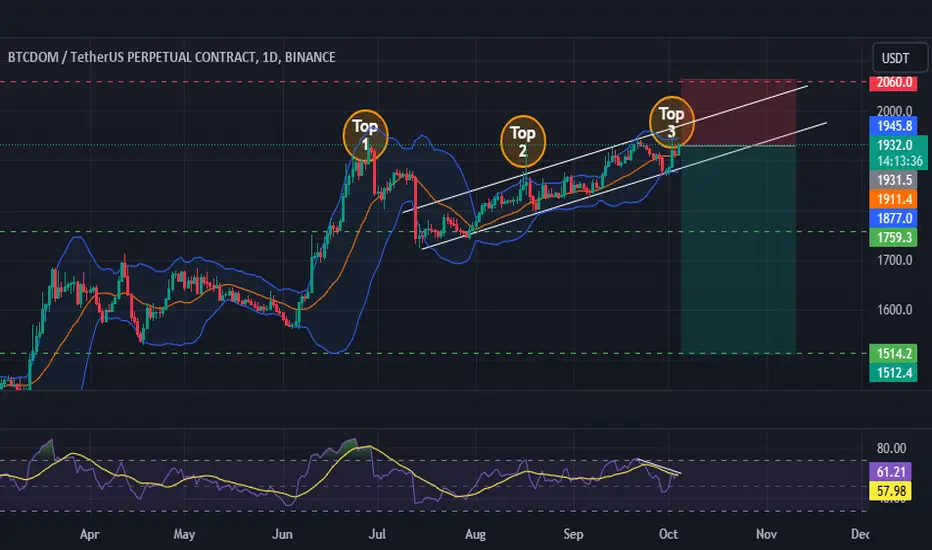
The chart before us has several distinct signs of bearish activities.
A Short trade should work fine here
Stop loss : 2060
Take profit 1 : 1759.3
Take profit 2 : 1515.2
The chart before us has several distinct signs of bearish activities.
- RSI Bearish Divergence
- Rising Wedge (It's not broken yet but it's a matter of time)
- Triple Top pattern (Not fully confirmed, but it's also a matter of time)
A Short trade should work fine here
Stop loss : 2060
Take profit 1 : 1759.3
Take profit 2 : 1515.2
手動でトレードを終了しました
This was a bad idea免責事項
これらの情報および投稿は、TradingViewが提供または保証する金融、投資、取引、またはその他の種類のアドバイスや推奨を意図したものではなく、またそのようなものでもありません。詳しくは利用規約をご覧ください。
免責事項
これらの情報および投稿は、TradingViewが提供または保証する金融、投資、取引、またはその他の種類のアドバイスや推奨を意図したものではなく、またそのようなものでもありません。詳しくは利用規約をご覧ください。