Hello friends:
It's the result of my efforts to offer a simple (using Graphical idea) presentation.
Concepts, I know you know ;)
Bullish: When demand is greater than supply, the price goes up
sideways: When demand is equal to supply, the price goes sideways
Bearish: When supply is greater than demand, the price goes up down
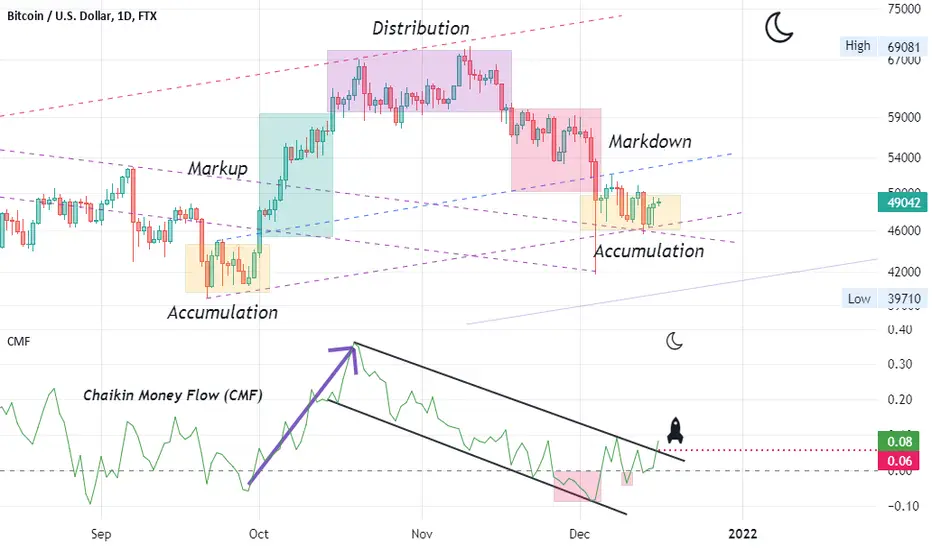
Chaikin Money Flow (CMF)
The main advantage of the CMF is that this indicator can assess the buying pressure vs the selling pressure.
1- Smart money is accumulating = increase CMF volume + candle closes near the top of its price
2- Distribution = decrease CMF volume + candle closes near the bottom of its price
Question: How is The Chaikin Money Flow Calculated ?
answer: it's not important (a bit complex!)
ノート
correction:Bearish: When supply is greater than demand, the price goes down
ノート
ノート
ノート
ノート
ノート
ノート
ノート
関連の投稿
免責事項
これらの情報および投稿は、TradingViewが提供または保証する金融、投資、取引、またはその他の種類のアドバイスや推奨を意図したものではなく、またそのようなものでもありません。詳しくは利用規約をご覧ください。
免責事項
これらの情報および投稿は、TradingViewが提供または保証する金融、投資、取引、またはその他の種類のアドバイスや推奨を意図したものではなく、またそのようなものでもありません。詳しくは利用規約をご覧ください。