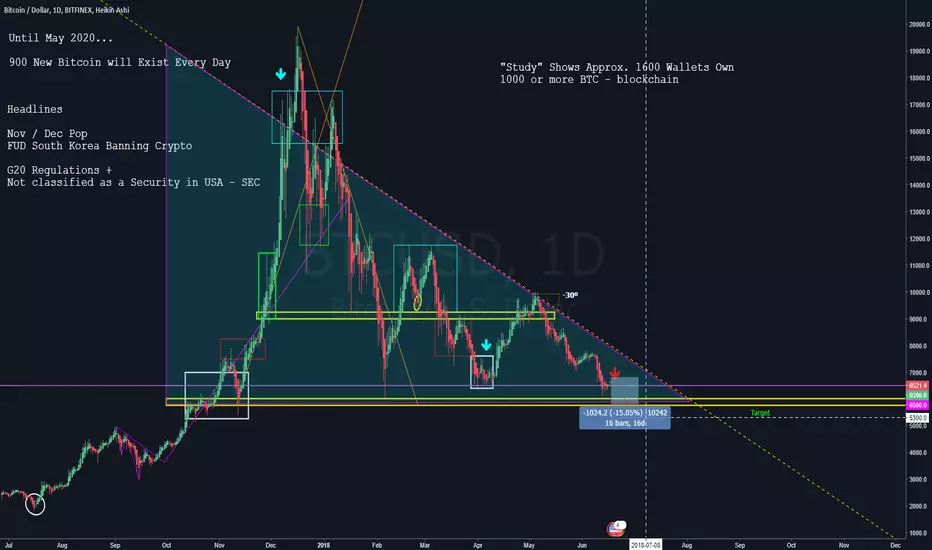
Here we can observe a Triangle Formation with many large Bearish candlesticks and occasional high volatility causes price to swing up to psychological areas on the chart.
Detailed Description to be created June 19
I appreciate you like this Technical Analysis!
I am not a Financial Advisor and you must accept full responsibility for any investment decisions you make with real money... Practice
Detailed Description to be created June 19
I appreciate you like this Technical Analysis!
I am not a Financial Advisor and you must accept full responsibility for any investment decisions you make with real money... Practice
免責事項
この情報および投稿は、TradingViewが提供または推奨する金融、投資、トレード、その他のアドバイスや推奨を意図するものではなく、それらを構成するものでもありません。詳細は利用規約をご覧ください。
免責事項
この情報および投稿は、TradingViewが提供または推奨する金融、投資、トレード、その他のアドバイスや推奨を意図するものではなく、それらを構成するものでもありません。詳細は利用規約をご覧ください。