since most of the liquidity goes through binance, this will be the primary chart i will be using going forward. previously i was using the kukoin chart, as that's the exchange i use, but this morning i learned that nothing else matters except this binance chart.
----
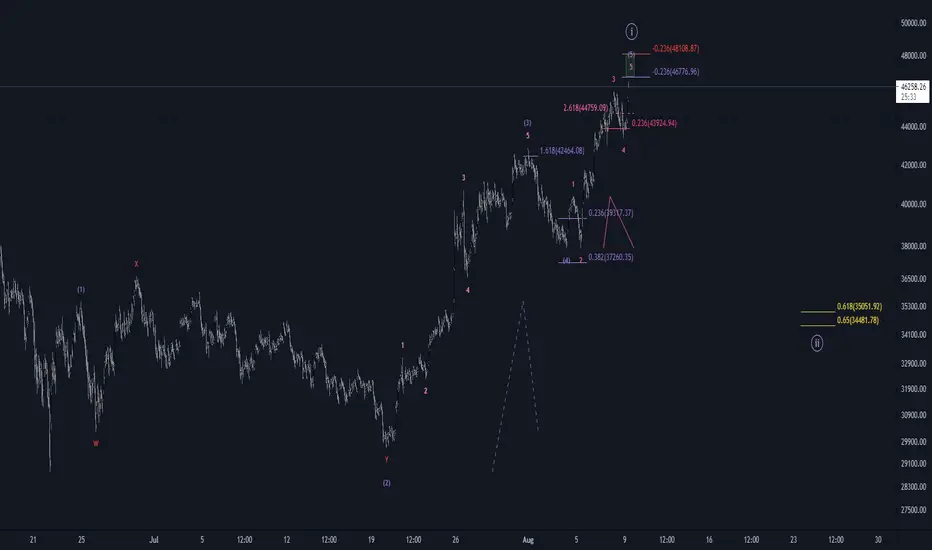
this last move on july 31st from 42885.28 ---> 37915.50 caught me off guard, and i bet i wasn't the only one.
the only chart that clearly shows what's going on is this binance chart, every single other exchange made a lower low for that move, which made things very confusing \ invalidated this larger picture.
this is the only scenario that i could possibly think of given the new data this morning.
looking for 47~48k to put in wave (1) on the higher degree, before the 0.618 wave (2) pullback to that 35k area.
this would in theory set us up for a much larger move to the upside.
----
this last move on july 31st from 42885.28 ---> 37915.50 caught me off guard, and i bet i wasn't the only one.
the only chart that clearly shows what's going on is this binance chart, every single other exchange made a lower low for that move, which made things very confusing \ invalidated this larger picture.
this is the only scenario that i could possibly think of given the new data this morning.
looking for 47~48k to put in wave (1) on the higher degree, before the 0.618 wave (2) pullback to that 35k area.
this would in theory set us up for a much larger move to the upside.
i only share a tiny fragment of my ideas on this platform. to view my daily work, join the lunar syndicate 9 👇
免責事項
これらの情報および投稿は、TradingViewが提供または保証する金融、投資、取引、またはその他の種類のアドバイスや推奨を意図したものではなく、またそのようなものでもありません。詳しくは利用規約をご覧ください。
i only share a tiny fragment of my ideas on this platform. to view my daily work, join the lunar syndicate 9 👇
免責事項
これらの情報および投稿は、TradingViewが提供または保証する金融、投資、取引、またはその他の種類のアドバイスや推奨を意図したものではなく、またそのようなものでもありません。詳しくは利用規約をご覧ください。