Technical Analysis and Outlook:
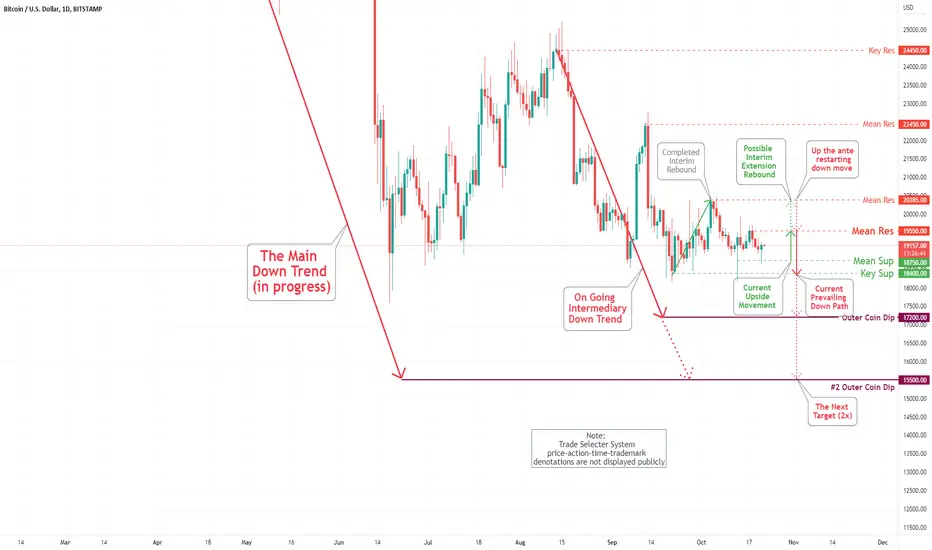
The Bitcoin is churning between our Mean Res $19,550 and Mean Sup $18,750. As specified on the Bitcoin (BTC/USD) Daily Chart Analysis For October 14, the possibility of moving to the Outer Coin Dip of $17,200 and extending the overall outcome to the #2 Outer Coin Dip at $15,500 is in the process. Reaching out in the short-term to the Mean Res $19,550 and possibly Mean Res $20,385 is blowing hot and cold.
The Bitcoin is churning between our Mean Res $19,550 and Mean Sup $18,750. As specified on the Bitcoin (BTC/USD) Daily Chart Analysis For October 14, the possibility of moving to the Outer Coin Dip of $17,200 and extending the overall outcome to the #2 Outer Coin Dip at $15,500 is in the process. Reaching out in the short-term to the Mean Res $19,550 and possibly Mean Res $20,385 is blowing hot and cold.
免責事項
この情報および投稿は、TradingViewが提供または推奨する金融、投資、トレード、その他のアドバイスや推奨を意図するものではなく、それらを構成するものでもありません。詳細は利用規約をご覧ください。
免責事項
この情報および投稿は、TradingViewが提供または推奨する金融、投資、トレード、その他のアドバイスや推奨を意図するものではなく、それらを構成するものでもありません。詳細は利用規約をご覧ください。