TRADERS AND INVESTORS,
The Bitcoin chart presents an interesting setup on the 1-hour timeframe (1 HTF). Here's a breakdown of recent price action:
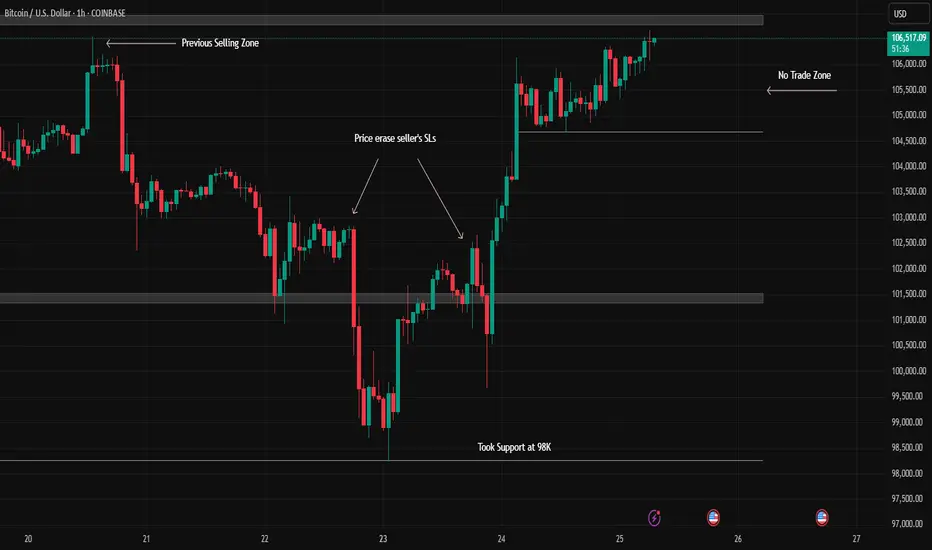
Initial Resistance & Downtrend: Bitcoin's chart indicated potential trend changes, with significant selling pressure at the $106,000 mark establishing a clear resistance level.
Downtrend Confirmation & Support: This was followed by a series of lower highs, confirming a downtrend. Subsequently, Bitcoin found support and bounced from the $98,000 level.
Potential Reversal Signal: The recent upward movement cleared sellers' stop-losses, which could be an early indication of a potential trend reversal.
WHAT MIGHT HAPPEN NEXT?
Currently, Bitcoin is re-testing the crucial $106,000 resistance level.
Bullish Scenario: A confirmed breakout and sustained move above $106,000 could signal the continuation of an uptrend.
Bearish Scenario: Conversely, a strong rejection from this level might lead to a decline, potentially targeting the $101,000 support.
Current Stance: At present, this area appears to be a no-trade zone due to the indecisive price action.
Disclaimer: This analysis is for educational purposes only and should not be considered financial advice. Always conduct your own research before making investment decisions.
The Bitcoin chart presents an interesting setup on the 1-hour timeframe (1 HTF). Here's a breakdown of recent price action:
Initial Resistance & Downtrend: Bitcoin's chart indicated potential trend changes, with significant selling pressure at the $106,000 mark establishing a clear resistance level.
Downtrend Confirmation & Support: This was followed by a series of lower highs, confirming a downtrend. Subsequently, Bitcoin found support and bounced from the $98,000 level.
Potential Reversal Signal: The recent upward movement cleared sellers' stop-losses, which could be an early indication of a potential trend reversal.
WHAT MIGHT HAPPEN NEXT?
Currently, Bitcoin is re-testing the crucial $106,000 resistance level.
Bullish Scenario: A confirmed breakout and sustained move above $106,000 could signal the continuation of an uptrend.
Bearish Scenario: Conversely, a strong rejection from this level might lead to a decline, potentially targeting the $101,000 support.
Current Stance: At present, this area appears to be a no-trade zone due to the indecisive price action.
Disclaimer: This analysis is for educational purposes only and should not be considered financial advice. Always conduct your own research before making investment decisions.
免責事項
この情報および投稿は、TradingViewが提供または推奨する金融、投資、トレード、その他のアドバイスや推奨を意図するものではなく、それらを構成するものでもありません。詳細は利用規約をご覧ください。
免責事項
この情報および投稿は、TradingViewが提供または推奨する金融、投資、トレード、その他のアドバイスや推奨を意図するものではなく、それらを構成するものでもありません。詳細は利用規約をご覧ください。