Hi friends, meet new bitcoin analysis.
Im looking for new forming Inverted Head and Shoulders pattern.
Technical analysis:
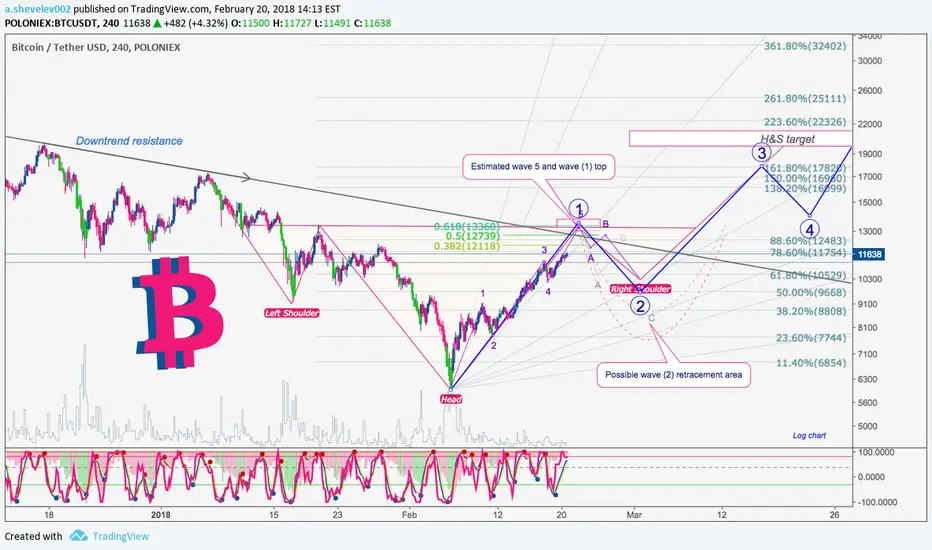
Now we are looking at Log Chart, to see Downtrend resistance which we just break in Linear chart, but it seems doesn't break in Log chart! So I started to dig more, to understand wave structure, and possible next movement.
Elliot Waves analysis:
Now we in 5 subwave of (1) wave, (1) is not completed yet, estimated wave 5 target is 12100-13360 zone. From this zone, we should wait for retracing in ABC correction (to complete bigger wave (1)-(2)).
On chart i showed the possible wave (2) retracement area, so be ready for this levels 10600 down to 7700 levels.
IMPORTANT PROPERTIES of Second waves:
Second waves often retrace so much of wave one that most of the profits gained up to that time are eroded away by the time it ends. At this point, investors are thoroughly convinced that bear market is back to stay. Second waves often end on very low volume and volatility, indicating a drying up of selling pressure.
So what to do?
1. Sell part at top of wave 5.
2. Buy partially at levels near wave 3-4 (right shoulder), and if going lower, buy the rest.
3. HODL whole (3) wave.
Join my Telegram Signals channel
Stay tuned, Artem Shevelev
Im looking for new forming Inverted Head and Shoulders pattern.
Technical analysis:
Now we are looking at Log Chart, to see Downtrend resistance which we just break in Linear chart, but it seems doesn't break in Log chart! So I started to dig more, to understand wave structure, and possible next movement.
Elliot Waves analysis:
Now we in 5 subwave of (1) wave, (1) is not completed yet, estimated wave 5 target is 12100-13360 zone. From this zone, we should wait for retracing in ABC correction (to complete bigger wave (1)-(2)).
On chart i showed the possible wave (2) retracement area, so be ready for this levels 10600 down to 7700 levels.
IMPORTANT PROPERTIES of Second waves:
Second waves often retrace so much of wave one that most of the profits gained up to that time are eroded away by the time it ends. At this point, investors are thoroughly convinced that bear market is back to stay. Second waves often end on very low volume and volatility, indicating a drying up of selling pressure.
So what to do?
1. Sell part at top of wave 5.
2. Buy partially at levels near wave 3-4 (right shoulder), and if going lower, buy the rest.
3. HODL whole (3) wave.
Join my Telegram Signals channel
Stay tuned, Artem Shevelev
トレード稼働中
ABC started earlier than expected,Short Trade:
Entry 10500-10600
Take Profit 1: 10100
Take Profit 2: 9500
Stop Loss: 11197
トレード稼働中
Short trade active 📲 Join Telegram Trading Community: t.me/+5hlxWmhHaKplN2Rk
🎙️ 𝘾𝙊𝙈𝙄𝙉𝙂 𝙎𝙊𝙊𝙉 Daily Live Streams on 🔴 𝗬𝗼𝘂𝗧𝘂𝗯𝗲
🔍 linktr.ee/artemcrypto ✅
🎙️ 𝘾𝙊𝙈𝙄𝙉𝙂 𝙎𝙊𝙊𝙉 Daily Live Streams on 🔴 𝗬𝗼𝘂𝗧𝘂𝗯𝗲
🔍 linktr.ee/artemcrypto ✅
関連の投稿
免責事項
この情報および投稿は、TradingViewが提供または推奨する金融、投資、トレード、その他のアドバイスや推奨を意図するものではなく、それらを構成するものでもありません。詳細は利用規約をご覧ください。
📲 Join Telegram Trading Community: t.me/+5hlxWmhHaKplN2Rk
🎙️ 𝘾𝙊𝙈𝙄𝙉𝙂 𝙎𝙊𝙊𝙉 Daily Live Streams on 🔴 𝗬𝗼𝘂𝗧𝘂𝗯𝗲
🔍 linktr.ee/artemcrypto ✅
🎙️ 𝘾𝙊𝙈𝙄𝙉𝙂 𝙎𝙊𝙊𝙉 Daily Live Streams on 🔴 𝗬𝗼𝘂𝗧𝘂𝗯𝗲
🔍 linktr.ee/artemcrypto ✅
関連の投稿
免責事項
この情報および投稿は、TradingViewが提供または推奨する金融、投資、トレード、その他のアドバイスや推奨を意図するものではなく、それらを構成するものでもありません。詳細は利用規約をご覧ください。