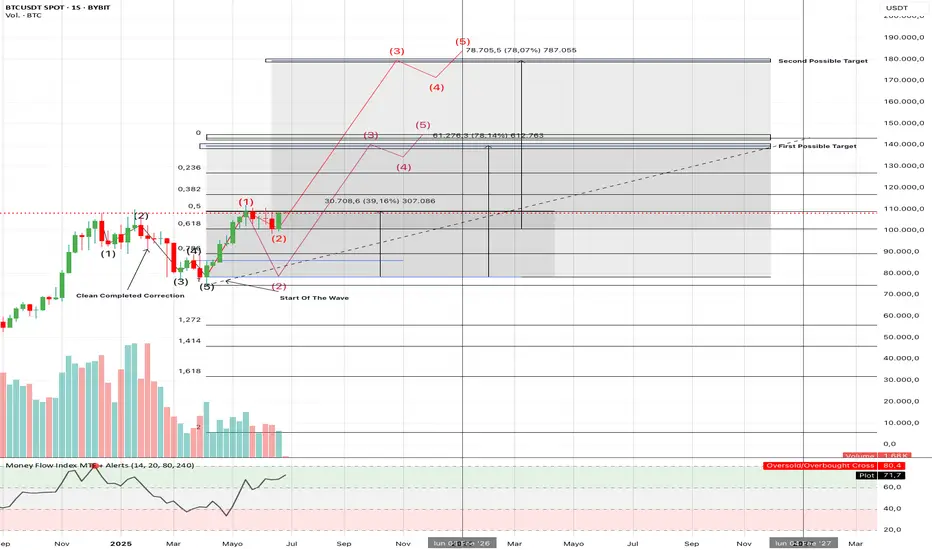
In this video, I present a weekly Elliott Wave analysis of Bitcoin ( 
 BTCUSDT ), focusing on the potential beginning of a new impulsive structure after a clean and technically complete corrective wave.
The current count suggests we are developing a Wave (1)-(2) sequence following the end of the correction, with the larger Wave 3 likely in progress. The projected targets are based on Fibonacci extensions, with the first objective near 140,000 USDT and a second potential target around 180,000 USDT if the impulsive structure unfolds fully.
The wave count includes:
A clearly labeled corrective phase (ABC-type structure) now completed.
Early signs of impulsive growth from the low labeled “Start of the Wave.”
Projections for higher degree waves ((3)), ((4)), and ((5)) based on historical expansion patterns.
RSI momentum and volume confirming the potential bullish continuation.
This analysis aims to provide a long-term technical roadmap using classical Elliott Wave methodology to assess risk and opportunity in the current BTC market.
🛑 Disclaimer: This content is for educational and informational purposes only. It does not constitute investment advice or a recommendation to buy or sell any asset. Always conduct your own research and analysis before making any financial decisions.
免責事項
この情報および投稿は、TradingViewが提供または推奨する金融、投資、トレード、その他のアドバイスや推奨を意図するものではなく、それらを構成するものでもありません。詳細は利用規約をご覧ください。
免責事項
この情報および投稿は、TradingViewが提供または推奨する金融、投資、トレード、その他のアドバイスや推奨を意図するものではなく、それらを構成するものでもありません。詳細は利用規約をご覧ください。