I had to Docukent this trade because it reminds of the time.
This time was slow.I tried to buy between two Moving Averages.
The 50 EMA and the 200 EMA.
Then I put a chart pattern.
This chart pattern is called the trendline support.
But there is a problem.
How do I use a chart pattern on forex trading?
And how do I trade with confidence so I used the following.
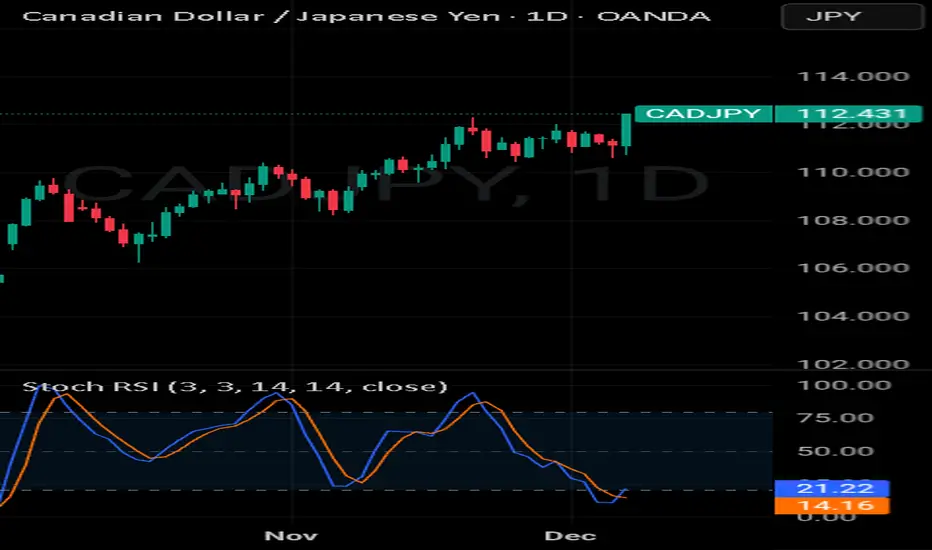
1-The trendline support
2-The Stochastic
3-RSI
These three tools are the mistakes that forex traders don't use.
Rocket boost this content to learn more.
Disclaimer ⚠️ Trading is risky please learn about risk management and profit taking strategies.
Also feel free to use a simulation trading account before you use real money.
This time was slow.I tried to buy between two Moving Averages.
The 50 EMA and the 200 EMA.
Then I put a chart pattern.
This chart pattern is called the trendline support.
But there is a problem.
How do I use a chart pattern on forex trading?
And how do I trade with confidence so I used the following.
1-The trendline support
2-The Stochastic
3-RSI
These three tools are the mistakes that forex traders don't use.
Rocket boost this content to learn more.
Disclaimer ⚠️ Trading is risky please learn about risk management and profit taking strategies.
Also feel free to use a simulation trading account before you use real money.
関連の投稿
免責事項
この情報および投稿は、TradingViewが提供または推奨する金融、投資、トレード、その他のアドバイスや推奨を意図するものではなく、それらを構成するものでもありません。詳細は利用規約をご覧ください。
免責事項
この情報および投稿は、TradingViewが提供または推奨する金融、投資、トレード、その他のアドバイスや推奨を意図するものではなく、それらを構成するものでもありません。詳細は利用規約をご覧ください。