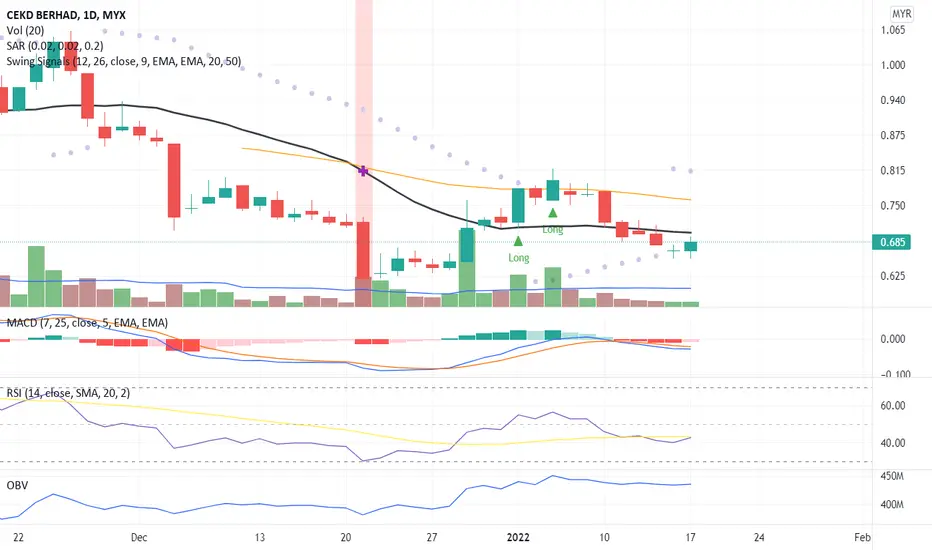
The candlestick indicates a reversal pattern where the price has a possibility to close above the MA20 line with high volumes supporting the price momentum.
RSI and OBV indicate a divergence signal and confirm the price momentum to the next resistance price level.
Let save CEKD in WL and watch out for significant price movement with volume supporting the price momentum.
R 0.700
S 0.655
RSI and OBV indicate a divergence signal and confirm the price momentum to the next resistance price level.
Let save CEKD in WL and watch out for significant price movement with volume supporting the price momentum.
R 0.700
S 0.655
免責事項
これらの情報および投稿は、TradingViewが提供または保証する金融、投資、取引、またはその他の種類のアドバイスや推奨を意図したものではなく、またそのようなものでもありません。詳しくは利用規約をご覧ください。
免責事項
これらの情報および投稿は、TradingViewが提供または保証する金融、投資、取引、またはその他の種類のアドバイスや推奨を意図したものではなく、またそのようなものでもありません。詳しくは利用規約をご覧ください。