Full Breakdown: CHF/USD – Double Top Reversal Pattern (15-Minute Chart)
🕵️♂️ 1. Market Context and Background
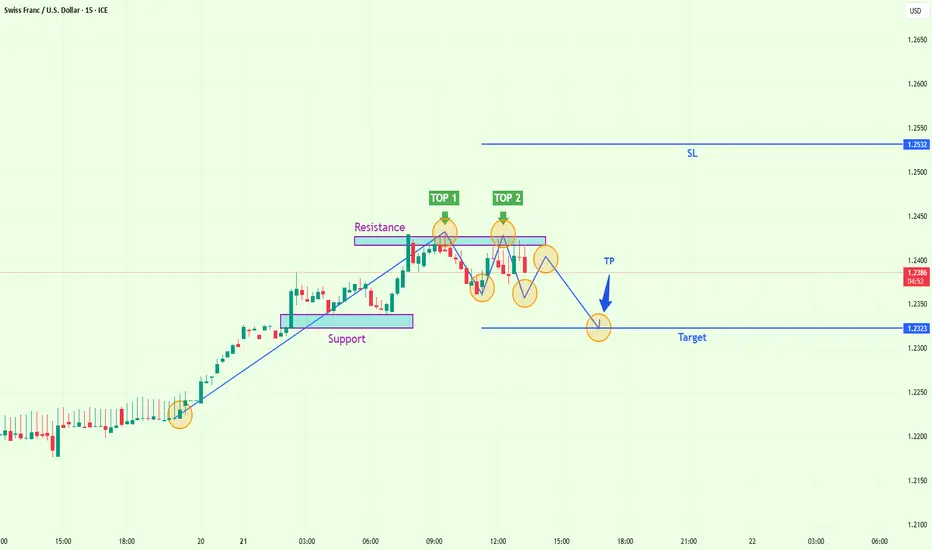
On this 15-minute CHF/USD chart, we observe a strong bullish rally that has now reached a technical exhaustion point. The market rallied from a consolidation base, creating higher highs and higher lows — until momentum began to falter at a well-defined resistance zone.
This pause in momentum transitioned into a distribution phase, signaling potential for a short-term trend reversal. The emerging Double Top pattern marks a clear shift in sentiment as buyers fail to maintain dominance.
📐 2. Key Price Zones & Structural Elements
🟪 Support Zone (Accumulation Phase)
Around 1.2320–1.2335, a base was formed, indicating accumulation.
Price broke out of this zone with strong bullish candles, signaling aggressive buying.
🟩 Uptrend Phase
After breaking support, price surged upward in impulsive candles.
This rally created a steep bullish trendline, which was respected until the resistance level was hit.
🟥 Resistance Zone (Distribution Phase)
Price found strong resistance at 1.2405–1.2415.
Two attempts to break this level failed, forming the Double Top (TOP 1 and TOP 2).
🔄 3. The Double Top Pattern – Explained Technically
📉 What It Is:
A Double Top is a classic bearish reversal pattern, signaling that buying pressure is weakening. After a strong bullish run, price fails to make a new high on the second attempt and reverses.
📍 Pattern Components:
Top 1: Initial high formed at the resistance level.
Valley: Pullback to neckline support around 1.2370.
Top 2: Second rejection at the same resistance. Often slightly lower or equal to the first.
Neckline: The level of support between the two tops — the critical zone for confirmation.
📉 4. Trade Setup and Execution Plan
✅ Entry Strategy
Wait for clear break below the neckline (~1.2370).
Ideal entry is on the retest of broken support, which often flips into resistance.
Confirmation can be added with bearish candlestick formations (e.g., bearish engulfing, shooting star, strong wick rejection).
🔒 Stop Loss (SL)
Placed above the recent highs / resistance zone at 1.2532.
Gives enough room to avoid fakeouts while managing risk.
🎯 Take Profit (TP)
Primary TP level is set at 1.2323, which aligns with:
Previous consolidation zone
Measured move from the Double Top height
This offers a strong risk-to-reward ratio (typically 1:2 or better).
🔍 5. Market Psychology Behind the Pattern
Top 1: Initial buyer euphoria hits a supply zone.
Pullback: Some buyers take profit; early sellers enter.
Top 2: Buyers try again but fail, showing fading momentum.
Breakdown: Sellers overwhelm remaining buyers at the neckline — triggering a shift in market control.
This psychological transition is often fast, especially on lower timeframes, making the retest an optimal entry point.
📘 6. Risk Management Tips
Use position sizing based on account risk (e.g., 1–2%).
Watch for false breakouts — avoid entering until retest confirms rejection.
Monitor volume or momentum indicators (optional) to confirm divergence or weakness near resistance.
📝 Conclusion
This CHF/USD chart shows an ideal Double Top setup supported by:
Clear structure
Strong resistance level
Reversal signals
Defined SL and TP zones
It represents a high-probability trade for short sellers anticipating a bearish move after trend exhaustion.
✅ “The best setups aren’t just about price patterns — they’re about reading the story behind the candles. This one tells us that bulls have likely lost control, and sellers are ready to step in.”
🕵️♂️ 1. Market Context and Background
On this 15-minute CHF/USD chart, we observe a strong bullish rally that has now reached a technical exhaustion point. The market rallied from a consolidation base, creating higher highs and higher lows — until momentum began to falter at a well-defined resistance zone.
This pause in momentum transitioned into a distribution phase, signaling potential for a short-term trend reversal. The emerging Double Top pattern marks a clear shift in sentiment as buyers fail to maintain dominance.
📐 2. Key Price Zones & Structural Elements
🟪 Support Zone (Accumulation Phase)
Around 1.2320–1.2335, a base was formed, indicating accumulation.
Price broke out of this zone with strong bullish candles, signaling aggressive buying.
🟩 Uptrend Phase
After breaking support, price surged upward in impulsive candles.
This rally created a steep bullish trendline, which was respected until the resistance level was hit.
🟥 Resistance Zone (Distribution Phase)
Price found strong resistance at 1.2405–1.2415.
Two attempts to break this level failed, forming the Double Top (TOP 1 and TOP 2).
🔄 3. The Double Top Pattern – Explained Technically
📉 What It Is:
A Double Top is a classic bearish reversal pattern, signaling that buying pressure is weakening. After a strong bullish run, price fails to make a new high on the second attempt and reverses.
📍 Pattern Components:
Top 1: Initial high formed at the resistance level.
Valley: Pullback to neckline support around 1.2370.
Top 2: Second rejection at the same resistance. Often slightly lower or equal to the first.
Neckline: The level of support between the two tops — the critical zone for confirmation.
📉 4. Trade Setup and Execution Plan
✅ Entry Strategy
Wait for clear break below the neckline (~1.2370).
Ideal entry is on the retest of broken support, which often flips into resistance.
Confirmation can be added with bearish candlestick formations (e.g., bearish engulfing, shooting star, strong wick rejection).
🔒 Stop Loss (SL)
Placed above the recent highs / resistance zone at 1.2532.
Gives enough room to avoid fakeouts while managing risk.
🎯 Take Profit (TP)
Primary TP level is set at 1.2323, which aligns with:
Previous consolidation zone
Measured move from the Double Top height
This offers a strong risk-to-reward ratio (typically 1:2 or better).
🔍 5. Market Psychology Behind the Pattern
Top 1: Initial buyer euphoria hits a supply zone.
Pullback: Some buyers take profit; early sellers enter.
Top 2: Buyers try again but fail, showing fading momentum.
Breakdown: Sellers overwhelm remaining buyers at the neckline — triggering a shift in market control.
This psychological transition is often fast, especially on lower timeframes, making the retest an optimal entry point.
📘 6. Risk Management Tips
Use position sizing based on account risk (e.g., 1–2%).
Watch for false breakouts — avoid entering until retest confirms rejection.
Monitor volume or momentum indicators (optional) to confirm divergence or weakness near resistance.
📝 Conclusion
This CHF/USD chart shows an ideal Double Top setup supported by:
Clear structure
Strong resistance level
Reversal signals
Defined SL and TP zones
It represents a high-probability trade for short sellers anticipating a bearish move after trend exhaustion.
✅ “The best setups aren’t just about price patterns — they’re about reading the story behind the candles. This one tells us that bulls have likely lost control, and sellers are ready to step in.”
関連の投稿
免責事項
これらの情報および投稿は、TradingViewが提供または保証する金融、投資、取引、またはその他の種類のアドバイスや推奨を意図したものではなく、またそのようなものでもありません。詳しくは利用規約をご覧ください。
免責事項
これらの情報および投稿は、TradingViewが提供または保証する金融、投資、取引、またはその他の種類のアドバイスや推奨を意図したものではなく、またそのようなものでもありません。詳しくは利用規約をご覧ください。