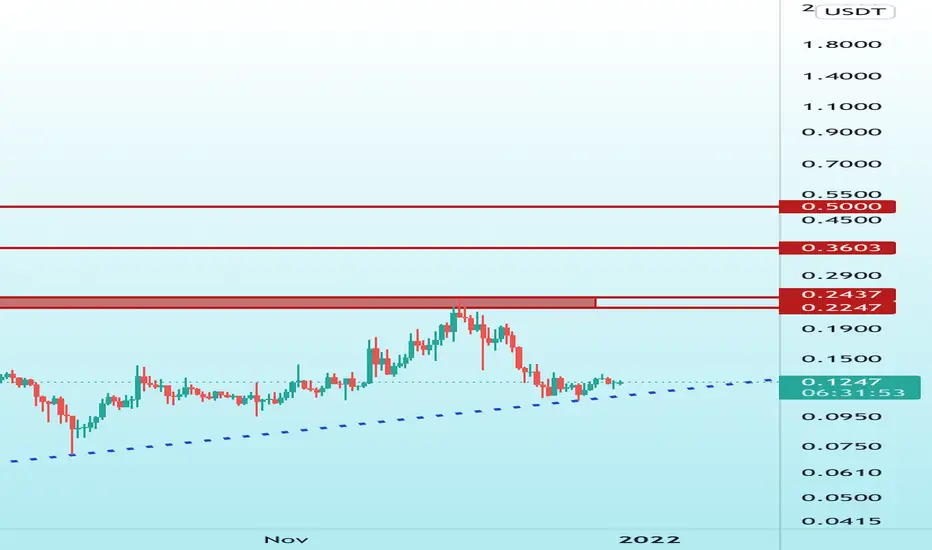
Price for daily timeframe is on trendline inside ascending triangle, It is most likely to test the neckline resistance zone. If the neckline resistance can be passed for the medium term, the targets are shown in the chart. ✌️
免責事項
この情報および投稿は、TradingViewが提供または推奨する金融、投資、トレード、その他のアドバイスや推奨を意図するものではなく、それらを構成するものでもありません。詳細は利用規約をご覧ください。
免責事項
この情報および投稿は、TradingViewが提供または推奨する金融、投資、トレード、その他のアドバイスや推奨を意図するものではなく、それらを構成するものでもありません。詳細は利用規約をご覧ください。