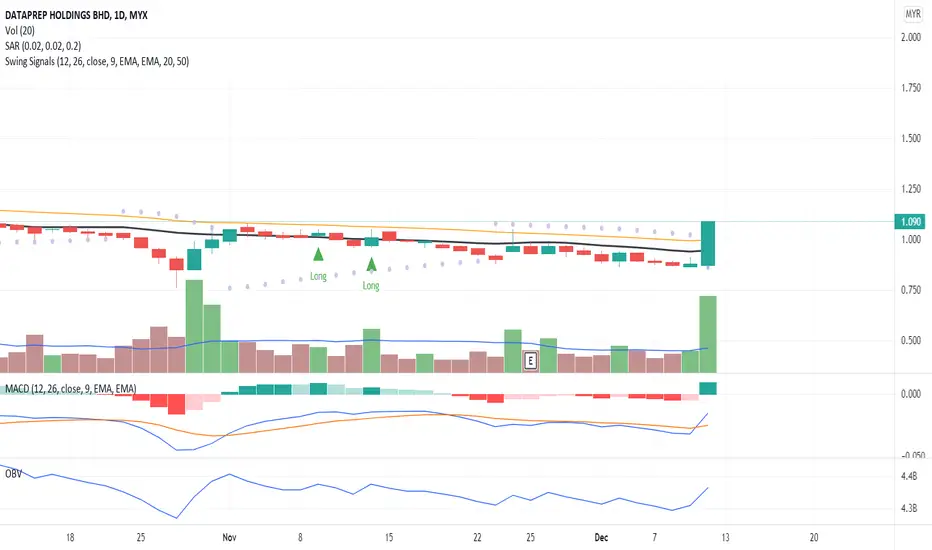
The candlestick body closed above MA20 due to significant price movement with volume confirming the price movement.
MACD and OBV charts indicate a divergence signal with a high probability of a long trend position.
The weekly chart timeframe also is in a positive uptrend. Same with MACD and OBV charts, indicate an early sign of a divergence signal.
Let put DATAPRP in the WL and watch out for price movement with volume.
R 1.110
S 0.940
関連の投稿
免責事項
この情報および投稿は、TradingViewが提供または推奨する金融、投資、トレード、その他のアドバイスや推奨を意図するものではなく、それらを構成するものでもありません。詳細は利用規約をご覧ください。
免責事項
この情報および投稿は、TradingViewが提供または推奨する金融、投資、トレード、その他のアドバイスや推奨を意図するものではなく、それらを構成するものでもありません。詳細は利用規約をご覧ください。