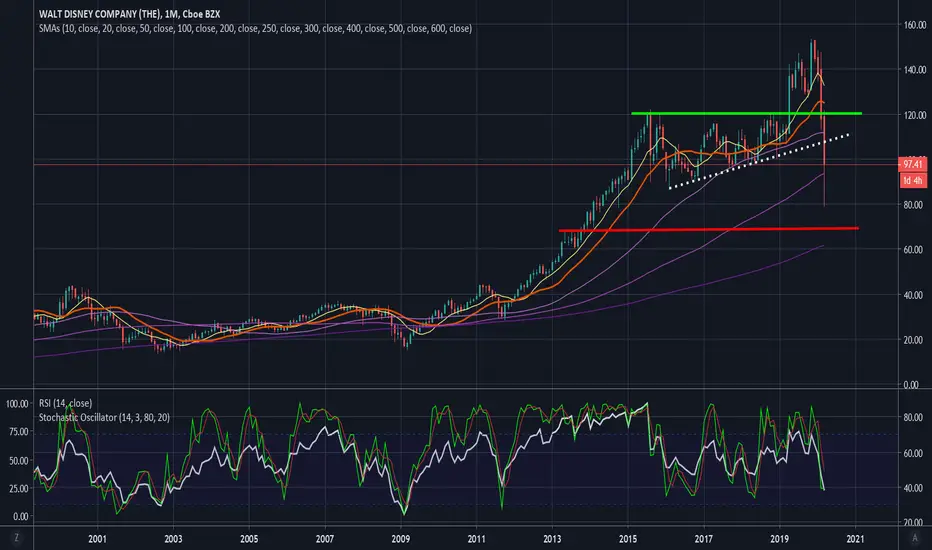
The white dotted line is from a previous chart. Stock may move up to that resistance line. It may also move up to 120 (green line) or down to 70 (red line). I am looking at daily RSI, along with other signals, to decide on puts or calls.
トレード稼働中
bought weekly 103 calls at 2.64. looking for 105 target and higher手動でトレードを終了しました
Out at 2.45. I see 30min resistance near 103, and RSI might stall around 60. daily RSI still below 50. stock may move up later but I lost confidence in trade after I took a better look at chart. Iトレード稼働中
Opening puts. I suggest weekly 100 puts, or 4/17 95 strike.免責事項
これらの情報および投稿は、TradingViewが提供または保証する金融、投資、取引、またはその他の種類のアドバイスや推奨を意図したものではなく、またそのようなものでもありません。詳しくは利用規約をご覧ください。
免責事項
これらの情報および投稿は、TradingViewが提供または保証する金融、投資、取引、またはその他の種類のアドバイスや推奨を意図したものではなく、またそのようなものでもありません。詳しくは利用規約をご覧ください。