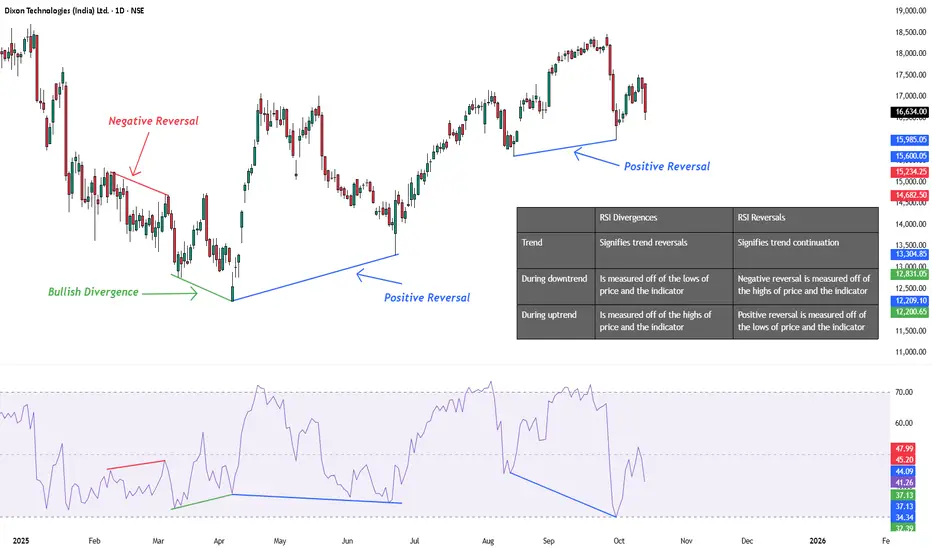
While most traders look for RSI divergences to catch tops and bottoms, RSI reversals often go unnoticed — yet they mark trend continuation points with precision.
In Dixon’s case, positive RSI reversals have repeatedly emerged at higher lows — each time leading to a renewed rally. The indicator is quietly hinting that the broader uptrend remains intact unless these structural lows break.
RSI Note:
Positive reversals = trend continuation.
Divergences = trend reversal signals.
Strategy:
Bias stays bullish as long as the recent higher-low structure holds.
Disclaimer:
This analysis is for educational purposes only and does not constitute investment advice. Please do your own research (DYOR) before making any trading decisions.
WaveXplorer | Elliott Wave insights
📊 X profile: @veerappa89
📊 X profile: @veerappa89
関連の投稿
免責事項
これらの情報および投稿は、TradingViewが提供または保証する金融、投資、取引、またはその他の種類のアドバイスや推奨を意図したものではなく、またそのようなものでもありません。詳しくは利用規約をご覧ください。
WaveXplorer | Elliott Wave insights
📊 X profile: @veerappa89
📊 X profile: @veerappa89
関連の投稿
免責事項
これらの情報および投稿は、TradingViewが提供または保証する金融、投資、取引、またはその他の種類のアドバイスや推奨を意図したものではなく、またそのようなものでもありません。詳しくは利用規約をご覧ください。