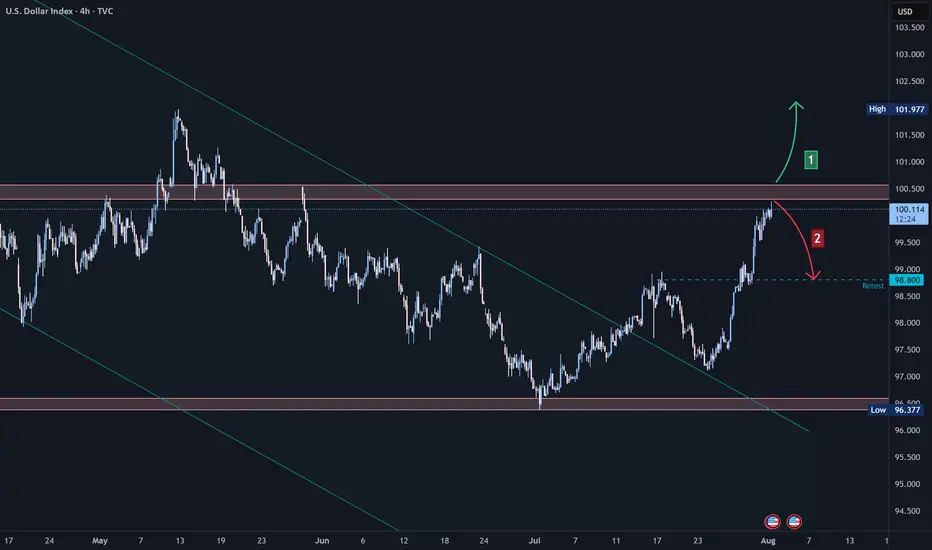
The DXY has recently exited a bearish wave, retested support levels, and began a recovery — currently trading near 100.09, a key resistance area.
🔹 If price breaks and holds above 100.09, the upward move may continue toward the 102.00 zone.
🔹 However, if the index rejects this level and reverses, a retest of 98.80 could follow.
⚠️ Disclaimer:
This analysis is for educational purposes only and does not constitute financial advice. Always perform your own analysis and monitor the markets before making any investment decisions.
免責事項
これらの情報および投稿は、TradingViewが提供または保証する金融、投資、取引、またはその他の種類のアドバイスや推奨を意図したものではなく、またそのようなものでもありません。詳しくは利用規約をご覧ください。
免責事項
これらの情報および投稿は、TradingViewが提供または保証する金融、投資、取引、またはその他の種類のアドバイスや推奨を意図したものではなく、またそのようなものでもありません。詳しくは利用規約をご覧ください。