ENAUSDT 4H Chart Analysis | Bullish Breakout Setup in Focus
🔍 Let’s dive into the ENAUSDT perpetual contract and analyze the recent price action, spotlighting key technical signals and a potential breakout scenario.
⏳ 4-Hour Overview
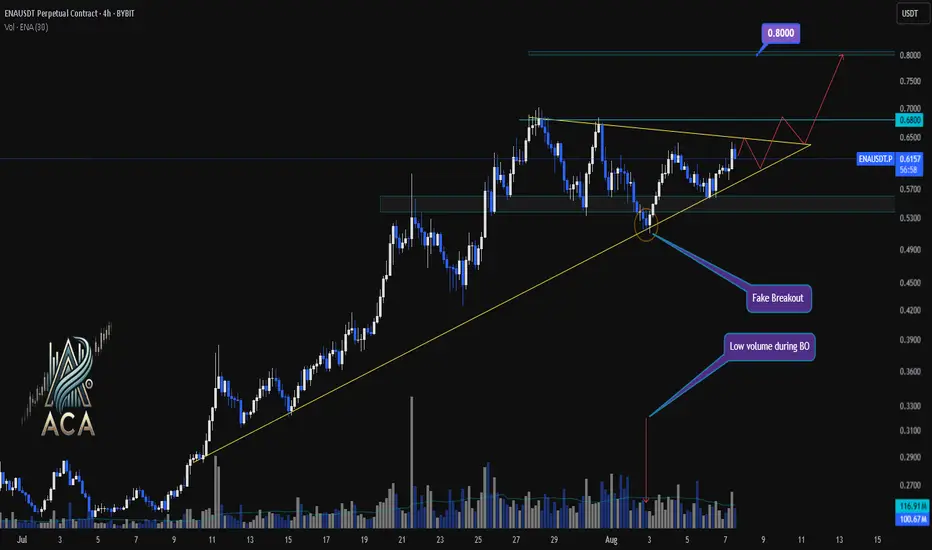
The 4-hour chart shows ENAUSDT consolidating above a critical ascending trendline, with price action tightening into a symmetrical triangle formation. Multiple attempts to break down have resulted in a fake breakout, as indicated by low volume during the breakdown — a classic sign of seller exhaustion.
🔺 Bullish Breakout Setup:
On the upside, a confirmed breakout above the $0.6800 resistance could pave the way for a bullish continuation towards the $0.8000 target zone. The structure suggests increasing buying pressure as long as price holds above the trendline and key support ($0.6050).
📊 Key Highlights:
- Price retested the ascending trendline; buyers defended it aggressively.
- A fake breakout with low volume suggests trap for bears and quick recovery by bulls.
- The next major resistance comes at $0.6800, with a projected target at $0.8000 upon breakout.
- Short-term support sits at $0.6050. Price action above this level remains constructive.
🚨 Conclusion:
Watch for a decisive move beyond triangle resistance. A high-volume breakout above $0.6800 could trigger a sharp move toward $0.8000. Bulls are building momentum — keep an eye on volume to confirm breakout strength.
🔍 Let’s dive into the ENAUSDT perpetual contract and analyze the recent price action, spotlighting key technical signals and a potential breakout scenario.
⏳ 4-Hour Overview
The 4-hour chart shows ENAUSDT consolidating above a critical ascending trendline, with price action tightening into a symmetrical triangle formation. Multiple attempts to break down have resulted in a fake breakout, as indicated by low volume during the breakdown — a classic sign of seller exhaustion.
🔺 Bullish Breakout Setup:
On the upside, a confirmed breakout above the $0.6800 resistance could pave the way for a bullish continuation towards the $0.8000 target zone. The structure suggests increasing buying pressure as long as price holds above the trendline and key support ($0.6050).
📊 Key Highlights:
- Price retested the ascending trendline; buyers defended it aggressively.
- A fake breakout with low volume suggests trap for bears and quick recovery by bulls.
- The next major resistance comes at $0.6800, with a projected target at $0.8000 upon breakout.
- Short-term support sits at $0.6050. Price action above this level remains constructive.
🚨 Conclusion:
Watch for a decisive move beyond triangle resistance. A high-volume breakout above $0.6800 could trigger a sharp move toward $0.8000. Bulls are building momentum — keep an eye on volume to confirm breakout strength.
免責事項
この情報および投稿は、TradingViewが提供または推奨する金融、投資、トレード、その他のアドバイスや推奨を意図するものではなく、それらを構成するものでもありません。詳細は利用規約をご覧ください。
免責事項
この情報および投稿は、TradingViewが提供または推奨する金融、投資、トレード、その他のアドバイスや推奨を意図するものではなく、それらを構成するものでもありません。詳細は利用規約をご覧ください。