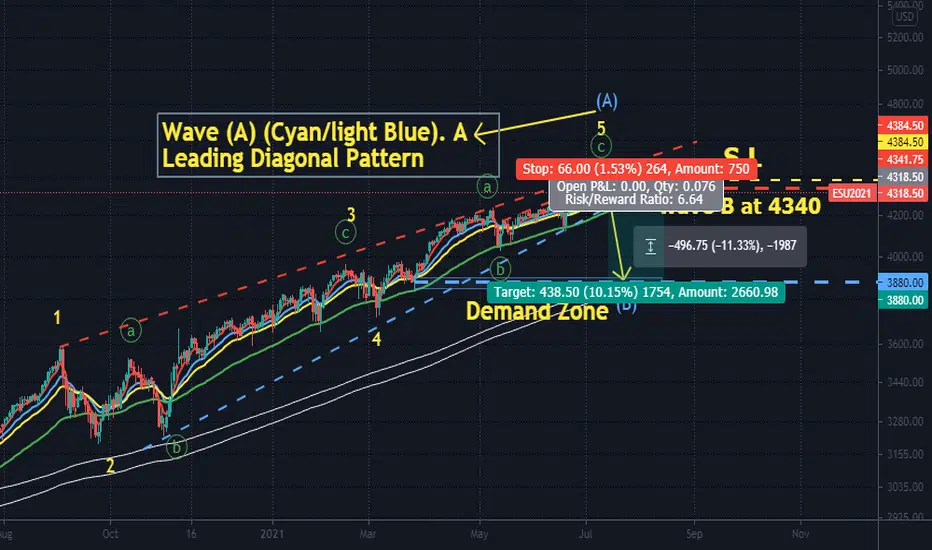
SPX with price breaking low of 4340 which is wave b of subwave of wave 5( Not shown on chart). SPX probably completed its leading diagonal pattern .. Short SPX toward around 3880 which is 1) Daily 200 EMA line 2) The Next Major Demand Zone ... Stop lost at 4384.50.... A Risk /Reward Ratio of about 6.64!
ノート
xyz3dtrading.. Charts consist of 3Dimensions - The X-factor ( Time or Cycle ), The Y- factor ( Price Geometry ), AND The Z-factor ( The Speed )ノート
It seem like SPX recent impulsive move down is a C leg of expanding flat pattern. SO SPX still will be breaking all time High again!免責事項
この情報および投稿は、TradingViewが提供または推奨する金融、投資、トレード、その他のアドバイスや推奨を意図するものではなく、それらを構成するものでもありません。詳細は利用規約をご覧ください。
免責事項
この情報および投稿は、TradingViewが提供または推奨する金融、投資、トレード、その他のアドバイスや推奨を意図するものではなく、それらを構成するものでもありません。詳細は利用規約をご覧ください。