Overview: let's review our expectations on the update of yesterday:
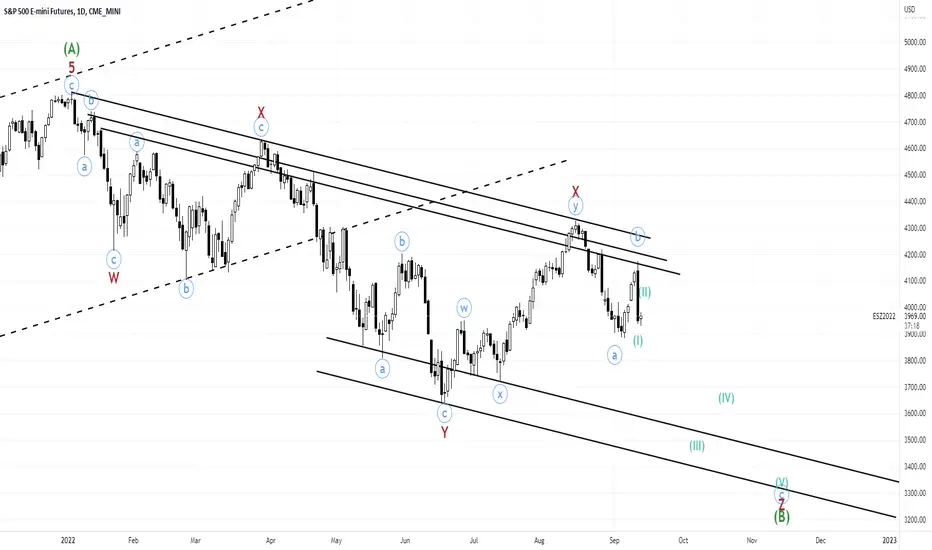
Update: Today we made lower low than yesterday daily candle, but both times it lead to strong bounces. Looking at the hourly chart, I think we have completed wave (I) and wave (II) is actually developing as a flat, with its wave b also as a flat. What follows is the continuation of the rally to complete wave c of (II) and then bear elevator comes with wave (III).

Potential target for wave (II) peak? (3994.25-4017.25)
1) Retracement of wave (I): 3994.25, 4017.25, and 4028.75
2) Volume profile of wave (I): 3995.75 (VAL) and 4004 (VPOC)
- Looking at the hourly chart, I believe today we completed waves a and b of (I) of c and wave c of (I) follows before we see a bounce as wave (II).
- Note that the drop caused by CPI news happened in a one-minute candle, which makes it impossible to see its subwaves and decide on its wave degree.
- Is it possible that we have actually completed wave (I) today and we bounce as wave (II) at this point? yes
Update: Today we made lower low than yesterday daily candle, but both times it lead to strong bounces. Looking at the hourly chart, I think we have completed wave (I) and wave (II) is actually developing as a flat, with its wave b also as a flat. What follows is the continuation of the rally to complete wave c of (II) and then bear elevator comes with wave (III).
Potential target for wave (II) peak? (3994.25-4017.25)
1) Retracement of wave (I): 3994.25, 4017.25, and 4028.75
2) Volume profile of wave (I): 3995.75 (VAL) and 4004 (VPOC)
関連の投稿
免責事項
これらの情報および投稿は、TradingViewが提供または保証する金融、投資、取引、またはその他の種類のアドバイスや推奨を意図したものではなく、またそのようなものでもありません。詳しくは利用規約をご覧ください。
免責事項
これらの情報および投稿は、TradingViewが提供または保証する金融、投資、取引、またはその他の種類のアドバイスや推奨を意図したものではなく、またそのようなものでもありません。詳しくは利用規約をご覧ください。