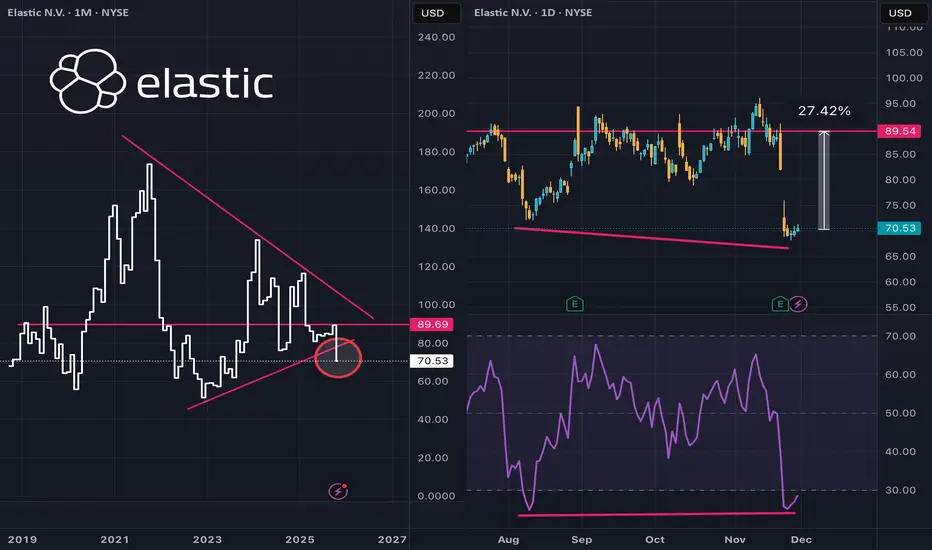
Even after a couple earnings beats in a row  ESTC has slipped below the bottom edge of a large symmetrical triangle.
Drilling into a daily chart and squinting a bit, there's a mild bullish momentum divergence. Hard to say if the bottom is in just yet, but it does look like one to put on the watch list.
WhenESTC swings into an uptrend, which could be just months away, the upside potential could be substantial.
Drilling into a daily chart and squinting a bit, there's a mild bullish momentum divergence. Hard to say if the bottom is in just yet, but it does look like one to put on the watch list.
When
ノート
Really nice breakout, that looks to be consolidating in prep for the next leg up関連の投稿
免責事項
この情報および投稿は、TradingViewが提供または推奨する金融、投資、トレード、その他のアドバイスや推奨を意図するものではなく、それらを構成するものでもありません。詳細は利用規約をご覧ください。
関連の投稿
免責事項
この情報および投稿は、TradingViewが提供または推奨する金融、投資、トレード、その他のアドバイスや推奨を意図するものではなく、それらを構成するものでもありません。詳細は利用規約をご覧ください。