The chart is in a downtrend sitting on big support, and we have sketched the two obvious branching paths.
Where we are now
⸻
Bull case – double bottom
The green double bottom is basically
For this to be “real” we want:
If that happens, measured move targets land somewhere in the mid-4ks, which lines up with your big green arrow.
Subjective odds right now: lower, maybe ~40% until that neckline breaks. We're trying to fight the prevailing downtrend; the pattern is only a potential bottom.
⸻
Bear case – inverse cup / rounded top
The red “inverse cup and handle” is basically a big rounded top since August
Bearish resolution would be
Given the existing downtrend and overhead MA gravity, continuation has the edge for now—call it ~60% vs the bullish reversal, unless the neckline is reclaimed.
⸻
Net take
So the market is basically asking: “Do we defend the 3k fortress, or do the MAs slowly grind everyone down?” The chart slightly favors the bears until price proves otherwise.
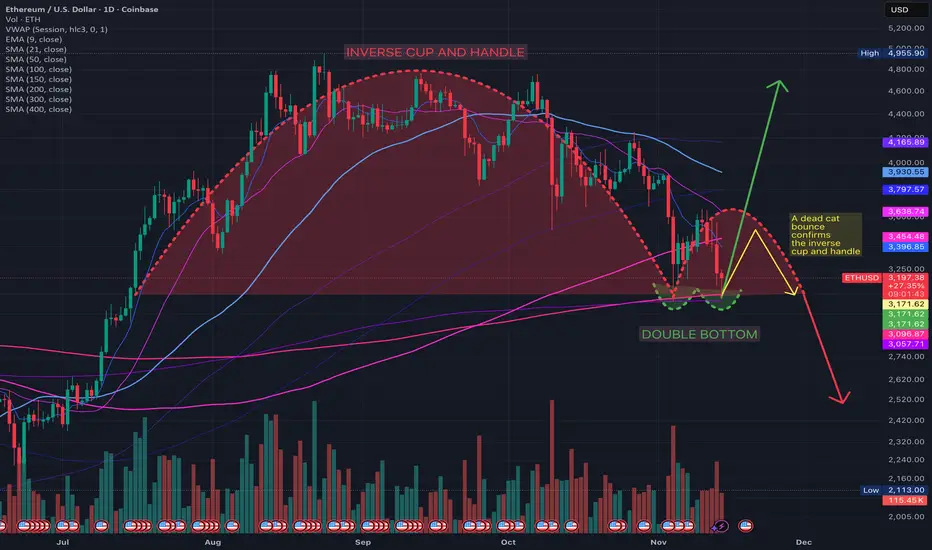
Where we are now
- Price ~3.2k, below the 9/21/50/100/150/200-day MAs but sitting on the 300–400-day cluster around 3.05–3.10k.
- That zone also matches the previous summer range = strong structural support.
- Trend is still clearly down until at least the 200-day (~3.45k) is reclaimed.
⸻
Bull case – double bottom
The green double bottom is basically
- Lows: ~3.05k–3.10k (twice).
- Neckline: the swing high between them, roughly ~3.5–3.6k.
For this to be “real” we want:
- decisive daily close above ~3.5–3.6k with volume.
- Ideally 200-day MA reclaimed and flattening.
If that happens, measured move targets land somewhere in the mid-4ks, which lines up with your big green arrow.
Subjective odds right now: lower, maybe ~40% until that neckline breaks. We're trying to fight the prevailing downtrend; the pattern is only a potential bottom.
⸻
Bear case – inverse cup / rounded top
The red “inverse cup and handle” is basically a big rounded top since August
- Series of lower highs, price rejected by falling MAs.
- Current bounce is so far just a retest of that declining structure / MA cluster from below.
Bearish resolution would be
- Failure somewhere under ~3.5k.
- Breakdown below 3.0–3.05k (loss of 300–400-day MAs and range support).
- That opens a move to the mid-2ks or worse, which is your red arrow scenario.
Given the existing downtrend and overhead MA gravity, continuation has the edge for now—call it ~60% vs the bullish reversal, unless the neckline is reclaimed.
⸻
Net take
- Above ~3.6k with volume → double bottom validated, trend potentially flips up.
- Below ~3.0k with conviction → rounded-top breakdown, expect acceleration down.
- In between 3.0–3.6k you’re in Schrödinger’s pattern: chop, fakeouts, and pain.
So the market is basically asking: “Do we defend the 3k fortress, or do the MAs slowly grind everyone down?” The chart slightly favors the bears until price proves otherwise.
免責事項
この情報および投稿は、TradingViewが提供または推奨する金融、投資、トレード、その他のアドバイスや推奨を意図するものではなく、それらを構成するものでもありません。詳細は利用規約をご覧ください。
免責事項
この情報および投稿は、TradingViewが提供または推奨する金融、投資、トレード、その他のアドバイスや推奨を意図するものではなく、それらを構成するものでもありません。詳細は利用規約をご覧ください。