Spot Strategy | 0xPareto Thesis
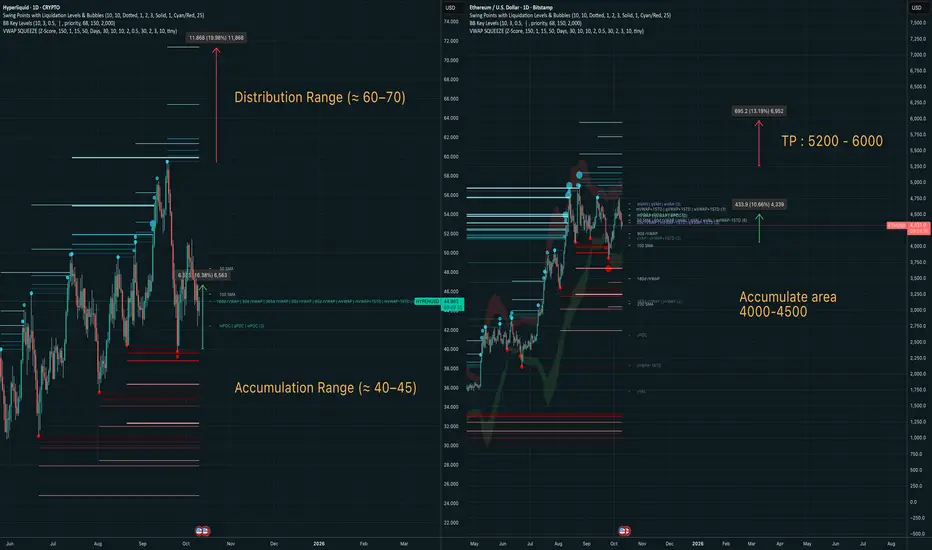
This chart visualizes the ongoing macro accumulation phase across both Ethereum and Hyperliquid, aligning with cyclical VWAP structure and liquidity maps.
Ethereum (Right):
Accumulation area: $4,000–$4,500
Target: $5,200–$6,000
Hyperliquid (Left):
Accumulation range: $40–$45
Distribution range: $60–$70
Mean reversion setup with high confluence on 180d VWAP and prior liquidity clusters.
免責事項
この情報および投稿は、TradingViewが提供または推奨する金融、投資、トレード、その他のアドバイスや推奨を意図するものではなく、それらを構成するものでもありません。詳細は利用規約をご覧ください。
免責事項
この情報および投稿は、TradingViewが提供または推奨する金融、投資、トレード、その他のアドバイスや推奨を意図するものではなく、それらを構成するものでもありません。詳細は利用規約をご覧ください。