Pattern & Technical Setup
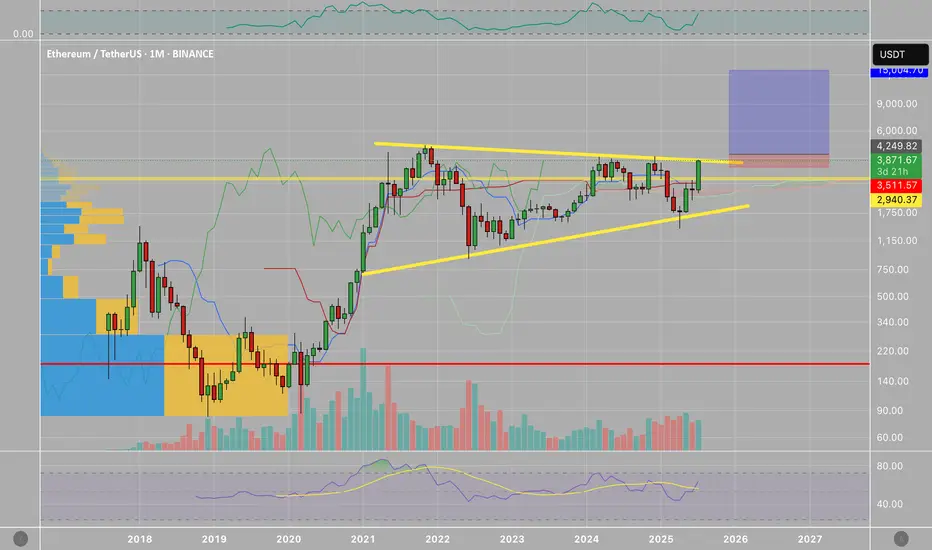
Ethereum (ETH/USDT) is showing a textbook symmetrical triangle pattern on the monthly chart. The pattern has been developing since the 2021 high, with lower highs converging with higher lows.
The current candle has broken out above the triangle’s upper trendline, suggesting a potential bullish continuation. This breakout is significant given the long consolidation period and strong volume profile near the breakout zone.
Trade Plan
• Entry: Around $4000 on confirmed monthly close above triangle.
• Stop Loss: Below $3,500 (safe side under breakout + previous support).
• Profit Targets:
$4,800 (measured move target based on triangle height)
⸻
Risk & Reward
• Risk: ~17% downside (stop at $2,950)
• Reward: ~253% upside to $4,800
• R/R Ratio: ~14:1 (favorable for swing trade)
YouTube goo.gl/BkRuQL
Twitter twitter.com/vilasignal
Twitter twitter.com/vilasignal
免責事項
これらの情報および投稿は、TradingViewが提供または保証する金融、投資、取引、またはその他の種類のアドバイスや推奨を意図したものではなく、またそのようなものでもありません。詳しくは利用規約をご覧ください。
YouTube goo.gl/BkRuQL
Twitter twitter.com/vilasignal
Twitter twitter.com/vilasignal
免責事項
これらの情報および投稿は、TradingViewが提供または保証する金融、投資、取引、またはその他の種類のアドバイスや推奨を意図したものではなく、またそのようなものでもありません。詳しくは利用規約をご覧ください。