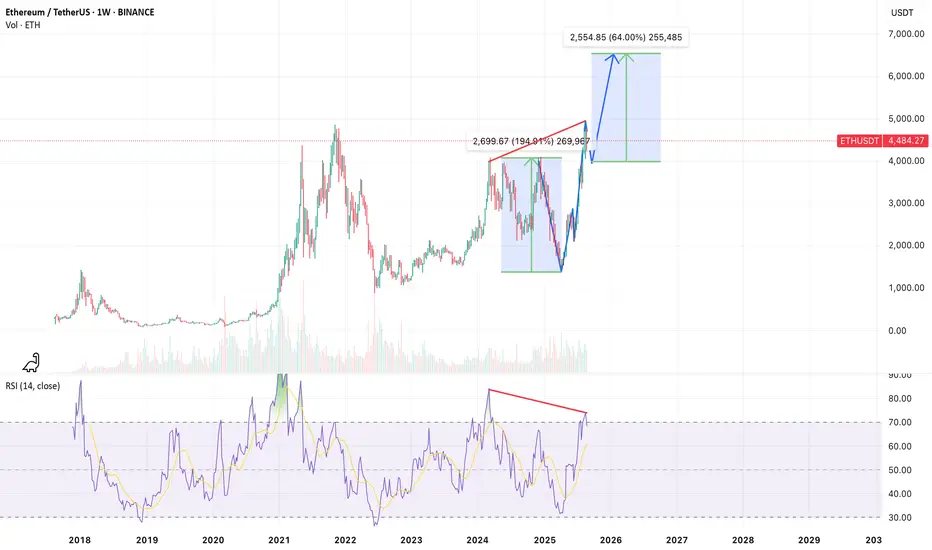
On the weekly timeframe, ETHUSDT is showing signs of a potential V-sharp reversal pattern. A mild bearish divergence can be observed at the recent highs, indicating the likelihood of a corrective move toward the $4,000 support zone before resuming the broader bullish trend targeting the $6,500 area.
For educational purposes only. This is not financial advice.
For educational purposes only. This is not financial advice.
免責事項
これらの情報および投稿は、TradingViewが提供または保証する金融、投資、取引、またはその他の種類のアドバイスや推奨を意図したものではなく、またそのようなものでもありません。詳しくは利用規約をご覧ください。
免責事項
これらの情報および投稿は、TradingViewが提供または保証する金融、投資、取引、またはその他の種類のアドバイスや推奨を意図したものではなく、またそのようなものでもありません。詳しくは利用規約をご覧ください。